UNITED STATES
SECURITIES AND EXCHANGE COMMISSION
Washington, D.C. 20549
SCHEDULE 14A
Proxy Statement Pursuant to Section 14(a) of the Securities
Exchange Act of 1934 (Amendment No. )
Filed by the Registrant þ
Filed by a Party other than the Registrant o
Check the appropriate box:
| o | Preliminary Proxy Statement | |
| o | Confidential, for Use of the Commission Only (as permitted by Rule 14a-6(e)(2)) | |
| þ | Definitive Proxy Statement | |
| o | Definitive Additional Materials | |
| o | Soliciting Material Pursuant to §240.14a-12 |
Hill-Rom Holdings, Inc.
(Name of Registrant as Specified In Its Charter)
(Name of Person(s) Filing Proxy Statement, if other than the Registrant)
Payment of Filing Fee (Check the appropriate box):
| þ | No fee required. | |||
| o | Fee computed on table below per Exchange Act Rules 14a-6(i)(1) and 0-11. | |||
| (1) | Title of each class of securities to which transaction applies: | |||
| (2) | Aggregate number of securities to which transaction applies: | |||
| (3) | Per unit price or other underlying value of transaction computed pursuant to Exchange Act Rule 0-11 (set forth the amount on which the filing fee is calculated and state how it was determined): | |||
| (4) | Proposed maximum aggregate value of transaction: | |||
| (5) | Total fee paid: | |||
| o | Fee paid previously with preliminary materials. | |||
| o | Check box if any part of the fee is offset as provided by Exchange Act Rule 0-11(a)(2) and identify the filing for which the offsetting fee was paid previously. Identify the previous filing by registration statement number, or the Form or Schedule and the date of its filing. | |||
| (1) | Amount Previously Paid: | |||
| (2) | Form, Schedule or Registration Statement No.: | |||
| (3) | Filing Party: | |||
| (4) | Date Filed: | |||


HILL-ROM HOLDINGS, INC.
PROXY
STATEMENT
Annual Meeting of Shareholders
March 4, 2015
10:00 am (Central Time)
Chicago, Illinois
HILL-ROM HOLDINGS, INC.
NOTICE OF ANNUAL SHAREHOLDER MEETING
To Be Held March 6, 20124, 2015
The annual shareholders meeting of shareholders of Hill-Rom Holdings, Inc., an Indiana corporation, will be held at the offices of Hill-Rom Holdings, Inc., 1069 State Route 46 East, Batesville, Indiana 47006, on Tuesday, March 6, 2012, at 10:00 a.m., Easternfollowing time and location, and for the following purposes:
 |
 | The offices of Hill-Rom Holdings, Inc., 180 North Stetson Avenue, Two Prudential Plaza, Suite 1630, Chicago, Illinois 60601. |
 | (1) | To elect |
| (2) | To consider and vote on a non-binding proposal to approve the compensation of Hill-Rom’s executive officers; |
| (3) | To ratify the appointment of PricewaterhouseCoopers LLP as the independent registered public accounting firm of Hill-Rom Holdings, Inc. for fiscal year |
| (4) | To transact any other items of business that may properly be brought before the meeting and any postponement or adjournment thereof. |
 | Only stockholders of record as of the close of business on December 31, 2014 are entitled |
Your vote is important. Whether or not you plan to attend the meeting, please cast your vote, as instructed in the Notice of Internet Availability of Proxy Materials, over the Internet, by telephone, or via mail, as promptly as possible. You may also request a paper proxy card to submit your vote by mail, if you prefer. We encourage you to vote via the Internet. We believe it is convenient for our shareholders, while significantly lowering the cost of our annual meeting and conserving natural resources.
| By Order of the Board of Directors | ||
  | ||
| Susan R. Lichtenstein | ||
| Secretary |
January 17, 201222, 2015
TABLE OF CONTENTS
| EXECUTIVE SUMMARY | 1 |
| GENERAL INFORMATION ABOUT THE ANNUAL MEETING AND VOTING | 4 |
| PROPOSALS REQUIRING YOUR VOTE | 8 |
| Proposal No. 1 – Election of Directors | 8 |
| Proposal No. 2 – Non-Binding Vote on Executive Compensation | 12 |
| Proposal No. 3 – Ratification of the Appointment of the Independent Registered Public Accounting Firm | 13 |
| CORPORATE GOVERNANCE | 14 |
| AUDIT COMMITTEE REPORT | 18 |
| SECURITY OWNERSHIP OF CERTAIN BENEFICIAL OWNERS AND MANAGEMENT | 19 |
| COMPENSATION DISCUSSION AND ANALYSIS | 22 |
| Compensation Committee Report | 22 |
| Detailed Table of Contents for CD&A | 22 |
| COMPENSATION OF NAMED EXECUTIVE OFFICERS | 34 |
| DIRECTOR COMPENSATION | 45 |
| EQUITY COMPENSATION PLAN INFORMATION | 47 |
| SECTION 16(A) BENEFICIAL OWNERSHIP REPORTING COMPLIANCE | 48 |
PROXY STATEMENT |
This proxy statement relates to the solicitation by the Board of Directors of Hill-Rom Holdings, Inc. (“Hill-Rom”, the “Company”, “we”, “us” or “our”), 1069 State Route 46 East, Batesville, Indiana 47006, telephone (812) 934-7777, of proxies for use at the annual meeting of Hill-Rom’s shareholders to be held at our offices located at 180 North Stetson Avenue, Two Prudential Plaza, Suite 1630, Chicago, Illinois 60601, on Tuesday,Wednesday, March 6, 2012,4, 2015, at 10:00 a.m., EasternCentral time, and at any adjournments of the meeting. This proxy statement and the enclosed form of proxy were mailed initially to shareholders on or about January 17, 2012.22, 2015.
EXECUTIVE SUMMARY |
This summary highlights selected information in this proxy statement. Please review the entire proxy statement and the Hill-Rom 2014 Annual Report before voting. This proxy statement and annual report to shareholders are available at www.proxyvote.com.
Key Fiscal 2014 Achievements
| · | Diversified our revenue base and expanded our product portfolio through the acquisition of Trumpf Medical, which provides a portfolio of surgical infrastructure solutions, for approximately $250 million. With the acquisition of Trumpf, approximately 40% of our revenue will be outside the United States. |
| · |
| · | Commercialized a number of new products, including a new ICU bed frame, the ProgressaTM, and a bed frame for the emerging markets called CenturisTM. We also commercialized significant new products in our Surgical & Respiratory division, including two airway clearance devices, VitalCoughTM and a new MetaNebTM, and a new surgical table, the Allen Advance TableTM. |
| · | Increased Hill-Rom’s dividend by approximately 10% for the fourth consecutive year. In the last four fiscal years, Hill-Rom has returned over $365 million to shareholders by dividends and repurchases. |
1
Voting Matters and Board Recommendations
| Proposal | Recommendation of the Board | Page References |
| To elect nine members to the Board of Directors for one year terms | FOR all nominees | 8 |
| To vote on a non-binding proposal to approve the compensation of Hill-Rom’s executive officers | FOR the proposal | 12 |
| To ratify the appointment of PricewaterhouseCoopers LLP as Hill-Rom’s independent registered public accounting firm for fiscal year 2015 | FOR ratification of the appointment | 13 |
Director | Audit Committee | Nominating/ Corporate Governance Committee | Compensation Committee | Mergers and Acquisitions Committee |
| Rolf A. Classon (Board Chair) (I) | ü | ü | C | |
| John J. Greisch | ü | |||
| William G. Dempsey (I) | ü | |||
James R. Giertz (I) | ü | |||
| Charles E. Golden (I) | C | ü | ü | |
| William H. Kucheman (I) | ü | ü | ||
| Ronald A. Malone (I) | ü | C | ü | |
| Eduardo R. Menascé (I) | ü | |||
| Stacy Enxing Seng* (I) | ||||
| Joanne Smith, M.D.* (I) | C | ü |
(I) Denotes independent director; (C) denotes chair
*Ms. Enxing Seng is a new nominee to the Board; Joanne Smith, M.D., will not stand for reelection.
Additional important information about our annual meeting and voting can be found in the section entitled “General Information About the Annual Meeting and Voting” beginning on page 4.
Governance Highlights
Our Board believes that good corporate governance enhances shareholder value. Our governance practices include:
| Governance Practice | For More Information |
| All of our directors, except our CEO, are independent | 15 |
| We have a non-executive, independent Board chair | 14 |
| Our directors attended on average 99% of Board and their respective committee meetings, and each attended more than 90% of the meetings of the Board and their respective committees | 15 |
| Our directors are elected annually, and we have a resignation policy if a director fails to garner a majority of votes cast | 8, 6 |
| Our independent directors meet regularly in executive session | 14 |
| We have a fully independent compensation consultant | 33 |
2
Hill-Rom’s compensation program is designed to align each executive’s compensation with Hill-Rom’s performance and the interests of our shareholders, and to provide the proper incentives to attract, retain and motivate key personnel in a clear, transparent manner. In order to do this, we:
| · | Generally target the 50th percentile of compensation paid by companies with which we compete for executive talent; |
| · | Provide an annual cash incentive award based on meaningful company performance metrics such as revenue and adjusted earnings per share, modified for individual performance; and |
| · | Align long-term equity compensation with our shareholder’s interests by linking realizable pay with stock performance through a combination of performance stock units, restricted stock units, and stock options. |
In summary, we compensate our named executive officers as follows:
| Component of Compensation | Form of Compensation |
| Base Salary | Annual Cash Salary |
| Annual Cash Incentive | 162(m) qualified plan, with negative discretion exercised by reference to our company-wide Short-Term Incentive Compensation Plan |
| Long-Term Incentive Compensation | Performance Stock Units (50% of annual grant value) Restricted Stock Units (25% of annual grant value) Stock Options (25% of annual grant value) |
We also adhere to several additional principles regarding executive compensation, which we believe highlight the strength of both our governance and our overall executive compensation program:
| Executive Compensation Principle | For More Information |
| We require significant stock ownership by our executive officers, including 6X base salary for our CEO; this was recently increased from 4X | 30 |
| We have clawback, anti-hedging and anti-pledging policies | 30 |
| We don’t re-price stock options or buy-back equity grants | 30 |
| Our executives all have at-will employment agreements | 31 |
We don’t have any single-trigger change in control agreements | 31 |
| We don’t provide gross-ups for perquisites or excise taxes, other than moving expenses | 31 |
3
| 1. | Who may vote? |
Shareholders holding shares of Hill-Rom common stock as of the close of business on December 30, 2011, the record date,31, 2014 are entitled to vote at the annual meeting. At the close of business on thesuch record date, there were 61,889,95056,499,594 shares of common stock outstanding and entitled to vote at the annual meeting. Common stock is the only class of stock outstanding and entitled to vote. You have one vote for each share of common stock held as of the record date, which may be voted on each proposal presented at the annual meeting.
| 2. | How can I elect to receive my proxy materials electronically? |
If you would like to reduce the costs incurred by us in mailing proxy materials, you can consent to receiving all future proxy statements, proxy cards and annual reports electronically. To sign up for electronic delivery, follow the instructions provided with your proxy materials and on your proxy card or voting instruction card to vote using the Internet, or go to https://enroll1.icsdelivery.com/hrc/Default.aspxhrc. When prompted, indicate that you agree to receive or access shareholder communications electronically in the future.
| 3. | Can I vote my shares by filling out and returning the Notice Regarding the Availability of Proxy Materials? |
No. See below for instructions on how to vote.
| 4. | How can I access the proxy materials over the Internet? |
You can view the proxy materials for the annual meeting on the Internet at www.proxyvote.com. Please have your 12 digit control number available, which can be found on your Notice Regarding the Availability of Proxy Materials or on your proxy card or voting instruction form. Our proxy materials are also available on our website at www.hill-rom.comhttp://ir.hill-rom.com.
| 5. | How does the Board recommend that I vote? |
The Board recommends that you vote
| · | FOR each of the nominees for director, |
| · | FOR the non-binding approval of the compensation of Hill-Rom’s executive officers, and |
| · | FOR the ratification of the appointment of PricewaterhouseCoopers LLP as Hill-Rom’s independent registered public accounting firm. |
| 6. | How do I vote? |
You may vote by any of the following methods:
| · | By Telephone or Internet — You may submit your proxy vote by following the instructions provided in the Notice Regarding the Availability of Proxy Materials, or by following the instructions provided with your proxy materials and on your proxy card or voting instruction form. |
| · | By Mail — You may submit your proxy vote by mail by signing a proxy card if your shares are registered directly in your name or, for shares held beneficially in street name, by following the voting instructions |
| · | In Person at the Annual Meeting — You may vote in person at the annual meeting or may be represented by another person at the meeting by executing a proxy designating that person. |
| 7. | If I |
No.
4
| 8. | Can I change my vote? |
If you are a shareholder of record, you may revoke your proxy at any time before the voting polls are closed at the annual meeting by the following methods:
| · | voting at a later time by telephone or Internet (up to 11:59 p.m. Eastern time on the day before the meeting); |
| · | writing our Corporate Secretary, Susan R. Lichtenstein, Hill-Rom Holdings, Inc., 1069 State Route 46 East, Batesville, Indiana 47006; or |
| · | giving notice of revocation to the Inspector of Election at the annual meeting. |
If you are a street name shareholder and you votevoted by proxy, you may later revoke your proxy by informing the holder of record in accordance with that entity’s procedures.
| 9. | What happens if I do not specify a choice for a proposal when returning a proxy? |
If you are a shareholder of record and your proxy card is signed and returned without voting instructions, it will be voted according to the recommendation of the Board of Directors.
If you are a beneficial/street name shareholder and fail to provide voting instructions, your broker, bank or other holder of record is permitted to vote your shares on the proposal to ratify the appointment of PricewaterhouseCoopers LLP as our independent registered public accounting firm. However, the record holderthey may not vote on the election of directors or on the proposal to regarding executive compensation absent instructions from you. Without your voting instructions on the proposals, a “broker non-vote” will occur.occur with respect to those proposals.
| 10. | How are votes, including broker non-votes and abstentions, counted? |
Votes are counted in accordance with our Amended and Restated Code of By-laws and Indiana law. A broker non-vote or abstention will be counted towards a quorum, but will not be counted in the election of directors or the votes on any of the other proposals.
| 11. | What constitutes a quorum? |
A majority of the outstanding shares of common stock entitled to vote, represented at the meeting in person or by proxy, constitutes a quorum. Broker non-votes and abstentions will be counted for purposes of determining whether a quorum is present.
| 12. | What happens if other matters come up at the annual meeting? |
The matters described in the notice of annual meeting are the only matters we know of that will be voted on at the annual meeting. If other matters are properly presented at the annual meeting, the persons named on the proxy card or voting instruction form will vote your shares according to their best judgment.
| 13. | Who will count the votes? |
A representative of Broadridge Financial Solutions, Inc., an independent tabulator appointed by the Board of Directors, will count the votes and act as the Inspector of Election. The Inspector of Election will have the authority to receive, inspect, electronically tally and determine the validity of the proxies received.
| 14. | Who can attend the annual meeting? |
Admission to the annual meeting is limited to shareholders of Hill-Rom, persons holding validly executed proxies from shareholders who held Hill-Rom common stock on December 30, 2011,31, 2014, and invited guests of Hill-Rom.
In order to be admitted to the annual meeting in person, you should pre-register by contacting Hill-Rom’s Investor Relations Department at investors@hill-rom.com, or in writing at Investor Relations, Hill-Rom Holdings, Inc., 1069 State Route 46 East, Batesville, IN 47006, no later than March 1, 2012.February 27, 2015. Additionally, proof of ownership of Hill-Rom stock must be shown at the door. Failure to pre-register or to provide adequate proof that you were a shareholder on the record date may prevent you from being admitted to the annual meeting. Please read the following rules carefully because they specify the documents that you must bring with you to the annual meeting in order to be admitted.
If you were a record holder of Hill-Rom common stock on December 30, 2011,31, 2014, then you must bring a valid government-issued personal identification (such as a driver’s license or passport).
If a broker, bank, trustee or other nominee was the record holder of your shares of Hill-Rom common stock on December 30, 2011,31, 2014, then you must bring:
| · | Valid government-issued personal identification (such as a driver’s license or passport), and |
| · | Proof that you owned shares of Hill-Rom common stock on December |
If you are a proxy holder for a shareholder of Hill-Rom, then you must bring:
| · | The validly executed proxy naming you as the proxy holder, signed by a shareholder of Hill-Rom who owned shares of Hill-Rom common stock on December |
| · | Valid government-issued personal identification (such as a driver’s license or passport), and |
| · | Proof of the shareholder’s ownership of shares of Hill-Rom common stock on December |
| 15. | How many votes must each proposal receive to be adopted? |
Directors are elected by a plurality of the votes cast by shareholders entitled to vote, which means that nominees who receive the greatest number of votes will be elected even if such amount is less than a majority of the votes cast. However, our Corporate Governance Standards provide that, prior to nomination, director nominees shall submit a letter of resignation that is effective in the event such director receives a greater number of votes “withheld” from his or her election than votes “for” such election. The Board is required to accept the resignation unless the Board determines that accepting such resignation would not be in the best interests of Hill-Rom and its shareholders.
The non-binding proposal to approve the compensation of our Named Executive Officers and the proposal to ratify the appointment of the independent registered public accounting firm will be approved if the votes cast favoring the action exceed the votes cast opposing the action.
| 16. | Who pays for the proxy solicitation related to the annual meeting? |
We do. In addition to sending you or making available to you these materials, some of our directors and officers, as well as management and non-management employees, may contact you by telephone, mail, e-mail or in person. You may also be solicited by means of press releases issued by Hill-Rom, postings on our website, and advertisements in periodicals. None of our officers or employees will receive any extra compensation for soliciting you. We have retained Innisfree M&A Incorporated to assist us in soliciting your proxy for an estimated fee of $8,000 plus reasonable out-of-pocket expenses. We will also reimburse banks, nominees, fiduciaries, brokers and other custodians for their costs of sending the Notice Regarding the Availability of Proxy Materials or proxy materials to the beneficial owners of Hill-Rom common stock.
| If I want to submit a shareholder proposal for the |
In order for shareholder proposals submitted pursuant to Rule 14a-8 under the Securities Exchange Act of 1934 to be presented at our 20132016 annual meeting of shareholders and included in our proxy statement and form of proxy relating to that meeting, such proposals must be submitted to the Secretary of Hill-Rom at our principal offices in Batesville, Indiana no later than September 19, 2012.
October 14, 2015, which is 120 days prior to the calendar anniversary of the mailing date of this proxy statement.
In addition, our Amended and Restated Code of By-laws provides that for business to be brought before a shareholders’ meeting by a shareholder or for nominations to the Board of Directors to be made by a shareholder for consideration at a shareholders’ meeting, notice thereof must be received by the Secretary of Hill-Rom at our principal offices not later than 100 days prior to the anniversary of the immediately preceding annual meeting, or not later than November 28, 201225, 2015 for the 20132016 annual meeting of shareholders. The notice must also provide certain information set forth in the Amended and Restated Code of By-laws.
6
| 18. | How can I obtain a copy of the Annual Report on Form 10-K? |
You may receive a hardcopy of proxy materials, including the Annual Report on Form 10-K, by following the directions set forth on the Notice Regarding the Availability of Proxy Materials. The Annual Report on Form 10-K is also available on our website at www.hill-rom.comhttp://ir.hill-rom.com.
| 19. | Where can I find the voting results of the annual meeting? |
We will announce preliminary voting results at the conclusion of the annual meeting and publish the final voting results in a Form 8-K to be filed with the U.S. Securities and Exchange Commission (“SEC”) within four business days after the conclusion of the annual meeting.
The Board currently consists of nine members, with three directors in each Class. Theand the terms of all the six directors in Classes I and III expire at the upcoming annual meeting. As previously announced, one of our current directors, Joanne Smith, M.D., has decided not to seek reelection to the Board. The shareholders will therefore elect sixnine members of the Board to serve one-year terms expiring at the 20132016 annual meeting of shareholders. Unless authority is withheld, all shares represented by proxies submitted pursuant to this solicitation (other than broker non-votes) will be voted in favor of electing as directors the nominees listed below for the terms indicated. If any of these nominees should be unable to serve, shares represented by proxies may be voted for a substitute nominee selected by the Board, or the position may become vacant.
The Board of Directors recommends that shareholders vote “FOR” the election to the Board of Directors of each of the nominees named below.
| Name | Age | Principal Occupation | Director Since |
| Rolf A. Classon | 69 | Chairman of the Board of Hill-Rom | 2002 |
| John J. Greisch | 59 | President and Chief Executive Officer of Hill-Rom | 2010 |
| William G. Dempsey | 63 | Retired Executive Vice President, Global Pharmaceuticals, Abbott Laboratories | 2014 |
| James R. Giertz | 57 | Senior Vice President and Chief Financial Officer of H.B. Fuller Company | 2009 |
| Charles E. Golden | 68 | Retired Executive Vice President and Chief Financial Officer of Eli Lilly and Company | 2002 |
William H. Kucheman | 65 | Former Interim Chief Executive Officer of Boston Scientific Corp. | 2013 |
| Ronald A. Malone | 60 | Retired Chief Executive Officer of Gentiva Health Services, Inc. | 2007 |
| Eduardo R. Menascé | 69 | Retired President, Enterprise Solutions Group, Verizon Communications | 2004 |
| Stacy Enxing Seng | 50 | Former President, Vascular Therapies, Covidien | New Nominee |
Name | Age | Principal Occupation | Served As A Director Since |
| Rolf A. Classon | 66 | Chairman of the Board of Hill-Rom | 2002 |
| James R. Giertz | 54 | Senior Vice President and Chief Financial Officer of H.B. Fuller Company | 2009 |
| Charles E. Golden | 65 | Retired Executive Vice President and Chief Financial Officer of Eli Lilly and Company | 2002 |
| W August Hillenbrand | 71 | Retired Chief Executive Officer of Hill-Rom | 1972 |
| Katherine S. Napier | 56 | Chief Executive Officer of Arbonne International, LLC | 2009 |
| Joanne C. Smith, M.D. | 51 | President and Chief Executive Officer of the Rehabilitation Institute of Chicago | 2003 |
Name | Age | Principal Occupation | Served As A Director Since |
| Ronald A. Malone | 57 | Retired CEO of Gentiva Health Services, Inc | 2007 |
| Eduardo R. Menascé | 66 | Retired President, Enterprise Solutions Group, Verizon Communications | 2004 |
| John J. Greisch | 56 | President and Chief Executive Officer of Hill-Rom | 2010 |
Mr. Classon has extensive experience in the health care industry, including positions in management and on the boards of several companies. His service as a senior officer in numerous largeinternational corporations brings an extensive breadth of knowledge and valuable insight to the Board.
JOHN J. GREISCH
Mr. Greisch was elected President & Chief Executive Officer of Hill-Rom effective January 8, 2010. Mr. Greisch was most recently President International Operations for Baxter International, Inc., a position he held since 2006. During his seven year tenure with Baxter, he also served as Baxter's Chief Financial Officer and as President of Baxter's BioScience division. Before his time with Baxter, he was President & CEO for FleetPride Corporation in Deerfield, Ill., an independent after-market distribution company serving the transportation industry. Prior to his tenure at FleetPride, he held various positions at The Interlake Corporation in Lisle, Ill., a leading global engineered materials and industrial equipment supplier, including serving as President of the company's Materials Handling Group. Mr. Greisch currently serves on the Board of Directors for Actelion Ltd, and AdvaMed. Additionally, he is on the Board of Directors for Ann & Robert H. Lurie Children's Hospital of Chicago. Through 2010, Mr. Greisch served as a director of TomoTherapy, Inc.
As the CEO of Hill-Rom, Mr. Greisch brings valuable multinational experience with multiple roles in a major public healthcare company, including as Chief Financial Officer, as well as operational insights and business knowledge to the Board.
WILLIAM G. DEMPSEY
Mr. Dempsey has extensive experience in the health care industry, including positions in management and on the boards of several companies. In addition, his international operations experience and his service as a senior officer at a large company makes him highly qualified to serve on the Board.
9
JAMES R. GIERTZ
Mr. Giertz has served as a director of Hill-Rom since 2009. He has been SeniorExecutive Vice President and Chief Financial Officer of H.B. Fuller Company, St. Paul, Minnesota, since March 2008. Prior to joining H.B. Fuller, he served as Senior Managing Director, Chief Financial Officer and, for several months in 2007 a director, of Residential Capital, LLC, one of the largest originators, servicers and securitizers of home loans in the United States, and asStates. Prior to that, he was Senior Vice President of the Industrial Products division, and Chief Financial Officer and as Senior Vice President, Industrial Products division withof Donaldson Company, Inc., a worldwide provider of filtration systems and replacement parts. In addition, Mr. Giertz has experience with General Motors Corporation where he served as assistant treasurer of the company's operations,parent company at General Motors, and also held several international treasury positions in Canada and Europe. Mr. Giertz also serves on the Board of Directors of Normandale Community College Foundation andthe Junior Achievement of the Upper Midwest.Midwest and the Board of Regents of Concordia University of St. Paul.
Mr. Giertz has extensive experience in financefinancial statement preparation and accounting, and operations, and his service as a senior officer in large corporations brings knowledge and valuable insight to the Board. In addition, his international operations experience is a valuable asset to the Board.
CHARLES E. GOLDEN
Mr. Golden has a comprehensive knowledge of both U.S. GAAP and IFRS, has extensive experience in financial statement preparation, accounting, corporate finance, risk management and investor relations both in the U.S. and Europe. His significant financial healthcare experience brings valuable financial operations rigor and insight to the Board.
Mr. Hillenbrand’s long historyKucheman’s executive experience with Hill-Rominvasive medical devices, including FDA regulation, commercialization process, government reimbursement, and its predecessor entities brings valuable insight and historical contextclinical marketing, makes him highly qualified to serve on the Board. In addition, his knowledge of Hill-Rom’s operations and business arising from his long history of service with the company provides a useful perspective for the Board’s other directors.
Mr. Malone has served as a director of Hill-Rom since July 2007. He has been a memberserved as Chairman of the Board of Directors of Gentiva Health Services Inc. since January 2009, having servedfrom 2002 to 2011, as Chairman and Chief Executive Officer offrom 2002 through 2008, and as a director through 2012. He joined Gentiva from June 2002 to December 2008. He servedin 2000 as Executive Vice President of Gentiva from March 2000 to June 2002 and as President of Gentiva's home health services division from January 2001 to June 2002.Gentiva’s Home Health Division. Prior to joining Gentiva, he served in various positions with Olsten Corporation including Executive Vice President of Olsten Corporation and President, Olsten Staffing Services, United States and Canada. He is a director of Gentiva Health Services, Inc., a director of Capital Senior Living, Inc., a former director of the National Association for Home Care & Hospice and a former director and chairman of the Alliance for Home Health Quality and Innovation.
Mr. Malone has an intimate knowledge of the home health industry and expertise in the legislative and regulatory landscape affecting healthcare companies. In addition, his experience as an officer of other health care companies provides the Board with valuable operational experience.
10
EDUARDO R. MENASCÉ
Mr. Menascé has broad experience as a former senior executive responsible for a significant international operation of a public company. This operational experience, his experience on other public company boards, and his experience as a director of the New York chapter of the National Association of Corporate Directors, all provide the Board with valuable insight.
Ms. Enxing Seng is a new nominee to the Board. She most recently served as an Executive in Residence for Covidien, as well as President of Covidien’s Vascular Therapies Division from 2012 to 2014, and President of Peripheral Vascular from 2010 to 2012. Ms. Enxing Seng joined Covidien in 2010 through the $2.6B acquisition of ev3 Incorporated, where she was a directorfounding member and executive officer responsible for leading ev3’s Peripheral Vascular division from 2001 to 2010. Prior to that, she held positions of Hill-Rom since July 2009. Ms. Napier has served as the Chief Executive Officer of Arbonne International, Inc. since August 2009. Arbonne International Inc. filed for Chapter 11 bankruptcy in January 2010increasing responsibility with SCIMED, Boston Scientific, American Hospital Supply and emerged in March 2010. Ms. Napier is also a 20-year veteran of Procter & Gamble, where from 1979 to 2002 she worked in a number of positions.Baxter. She also served as senior vice president of marketing at McDonald's Corporation. Ms. Napier currently serves on the boards of directors of Exact Sciences Corporation, is a member of the Board of Trustees of Xavier University,Sonova Holding AG, Solace Therapeutics, and the Board of Visitors of Wake Forest University Calloway School of Business.
Ms. Enxing Seng has broad experience as a former senior executive responsible for a world-wide business unit of numerous companies makea major medical device company. In addition, she has significant experience as a co-founder of a successful medical device start-up. Her operational experience at a large medical device company, combined with her broad scope experience gained from her role as a co-founder of a medical device company, provide the Board with valuable addition.insights in a variety of marketing, sales and other areas.
“RESOLVED, that the shareholders of Hill-Rom Holdings, Inc. approve, on an advisory basis, the compensation of the Company’s named executive officers and the overall compensation policies and procedures employed by Hill-Rom, disclosed pursuant to Item 402 of Regulation S-K, and described in the Compensation Discussion and Analysis and the tabular disclosure regarding named executive officer compensation (together with the accompanying narrative disclosure) in this proxy statement.”
As described under “Compensation Discussion and Analysis” beginning on page 18,22, our philosophy in setting executive compensation is to provide a total compensation package that allows us to continue to attract, retain and motivate talented executives who drive our Company’s success, while aligning compensation with the interests of our shareholders and ensuring accountability and transparency. Consistent with the philosophy, a significant percentagemajority of the total compensation opportunity for each of our named executive officers is based on measurable corporate, business area and individual performance, both financial and non-financial, and on the performance of our shares on a long-term basis. The cumulative total return (which includes reinvestment of dividends) of our Common Stock from April 1, 2008 (the date of our spin-off of our former funeral services business) through December 31, 2011, is approximately 35.4%. This exceeds the returns of the S&P 500 and our 2011 peer group over the same period, which returned -8.2% and 5.4%, respectively.
Because your vote is advisory, it will not be binding on the Board of Directors. However, the Compensation and Management Development Committee (the “Compensation Committee”) will take into account the outcome of the vote when considering future executive compensation arrangements.
The Board of Directors recommends that you vote “FOR” the approval of this resolution.
Subject to shareholder ratification, the Audit Committee of our Board has appointed PricewaterhouseCoopers LLP (“PwC”) as our independent registered public accounting firm for the fiscal year ending September 30, 2012.2015. Representatives from PwC will be present at the annual meeting with an opportunity to make a statement, if they so desire, and will be available to respond to appropriate questions.
The Audit Committee has adopted a policy requiring that all services from the outside independent registered public accounting firm must be pre-approved by the Audit Committee or its delegate and has adopted guidelines that non-audit related services, including tax consulting, tax compliance and tax preparation fees, should not exceed the total of audit and audit related fees. During fiscal 2011,2014, PwC’s fees for non-audit related services fell within these guidelines.
The following table presents fees for professional services rendered by PwC for the audit of our annual consolidated financial statements for the years ended September 30, 20112013 and 2010,2014, and fees billed for other services rendered by PwC during those periods.
2011 | 2010 | |||||||
| Audit Fees (1) | $1,607,280 | $1,485,500 | ||||||
| Audit-Related Fees (2) | 515,500 | 262,288 | ||||||
| Tax Fees (3) | 130,000 | 48,000 | ||||||
| All Other Fees (4) | 1,500 | 1,500 | ||||||
| Total | $2,254,280 | $1,797,288 | ||||||
| 2013 | 2014 | |||
| Audit Fees (1) | $2,628,580 | $2,783,900 | ||
| Tax Fees (2) | $943,800 | $355,732 | ||
| All Other Fees (3) | $146,800 | $146,800 | ||
| Total | $3,719,180 | $3,286,432 |
| Audit Fees were billed by PwC for professional services rendered for the integrated audit of our consolidated financial statements and our internal control over financial reporting, along with the review and audit of the application of new accounting pronouncements, SEC releases, |
| Tax Fees were billed by PwC for professional services rendered for tax compliance, tax advice and tax planning. |
| All Other Fees were fees billed by PwC for all other products and services provided to us. |
The Board recommends that you vote “FOR” the ratification of the appointment of PricewaterhouseCoopers LLP as Hill-Rom’s independent registered public accounting firm.
Board Leadership
The Board is currently led by our non-executive independent Chair, Mr. Classon. The Board has determined that the leadership of the Board is best conducted by an independent Chair. This allows the Chair to provide overall leadership to the Board in its oversight function, while the Chief Executive Officer, Mr. Greisch, provides leadership with respect to the day-to-day management and operation of our business. We believe the separation of the offices allows Mr. Classon to focus on managing Board matters and allows Mr. Greisch to focus on managing our business. In addition, we believe the separation of the offices enhances the objectivity of the Board in its management oversight role.
Executive sessions or meetings(meetings of outside and independent directors without management presentpresent) are held regularly at the beginning and end of Board meetings, and, depending on directors’ desire, from time to time during Board and committee meetings. The Chair generally presides at executive sessions of non-management directors, except that the chairs of the committees of the Board preside at executive sessions of non-management directors held following meetings of their committees or at which the principal items to be considered are within the scope or authority of their committees.directors.
Board’s Role in Strategic Planning and Oversight of Risk Management
The Board is responsible for directing and overseeing the management of Hill-Rom’s business in the best interests of the shareholders and consistent with good corporate citizenship. The Board sets strategic direction and priorities for the Company, approves the selection of the senior management team and oversees and monitors risks and performance. At Board meetings during the year, members of senior management review their organizations and present their long-range strategic plans to the Board, and at the start of each fiscal year, the Board reviews and approves anthe Company’s operating plan and budget for the next year.
A fundamental part of setting Hill-Rom’s business strategy is the assessment of the risks Hill-Rom faces and how they are managed. Senior management regularly meets to review and discuss the Company’s top enterprise risks. The output of these meetings is provided and discussed at each Board meeting. In addition, the Board, the Nominating/Corporate Governance, and the Audit CommitteeCommittees meet regularly throughout the year with our financial and treasury management teams and with our Chief Compliance Officer, Vice President, Internal Audit and Chief Legal Officer to assess the financial, legal/legal, compliance, and operational/strategic risks throughout our businesses and review our insurance and other risk management programs and policies in order topolicies. These regular meetings enable the Board to exercise its ultimate oversight responsibility for Hill-Rom’s risk management processes.
In addition, the Compensation Committee assesses Hill-Rom’s compensation structure on a regular basis to appropriately align risks and incentives for our executive management. See “Compensation Discussion and Analysis” below for additional information.
Communications with Directors
Shareholders of Hill-Rom and other interested persons may communicate with the Chair of the Board, the chairs of Hill-Rom’s Nominating/Corporate Governance Committee, Audit Committee or Compensation Committeecommittees of the Board, or the non-management directors of Hill-Rom as a group by sending an email to investors@hill-rom.com. The email should specify which of the foregoing is the intended recipient.
Director Attendance at Annual Meeting
Hill-Rom currently does not have a formal policy regarding director attendance at its annual meetings of shareholders, but all of Hill-Rom’s directors generally do attend the annual meetings. The Chair of the Board presides at the annual meeting of shareholders, and the Board holds one of its regular meetings in conjunction with the annual meeting of shareholders. All members of the Board at the time of our 20112014 annual meeting of shareholders attended that meeting in person.
Corporate Governance Standards and Code of Ethics
The Board has adopted Corporate Governance Standards for the Board of Directors that provide the framework for the effective functioning of the Board of Directors. In addition, the Board has adopted a Global Code of Conduct that applies to everyone who conducts business for and with Hill-Rom including all directors, officers, and other employees of Hill-Rom including Hill-Rom’s Chief Executive Officer, Chief Financial Officersuppliers and Chief Accounting Officer,other business partners, and which constitutes a “code of ethics” within the meaning of Item 406 of the SEC’s Regulation S-K. The Board reviews, from time to time, and makes changes to the Code based on recommendations made by the Audit Committee of the Board. They are both available via the Investor Relations section of the Hill-Rom website at http://ir.hill-rom.com.
Determinations with Respect to Independence of Directors
The Board determines the independence for each member of the Board based on an annual evaluation performed and recommendations made by the Nominating/Corporate Governance Committee, consistent with the applicable rules of the New York Stock Exchange. When making these determinations, the Board considered these standards, and in particular considered the following:
Based on these standards and all relevant facts and circumstances, the Board has determined that each of Rolf A. Classon, William G. Dempsey, James R. Giertz, Charles E. Golden, William H. Kucheman, Ronald A. Malone, Eduardo R. Menascé, Katherine S. Napier and Joanne C. Smith, M.D. is independent, and that neither W August Hillenbrand nor John J. Greisch are independent.is not independent, and that Stacy Enxing Seng will be independent, assuming her election to the Board.
Transactions with Related Persons
The Corporate Governance Standards for the Board require that all new proposed related party transactions involving executive officers or directors must be reviewed and approved by the Nominating/Corporate Governance Committee. The Corporate Governance Standards do not specify the standards to be applied by the Nominating/Corporate Governance Committee in reviewing transactions with related persons. However, we expect that in general the Nominating/Corporate Governance Committee will consider all of the relevant facts and circumstances, including: the benefits to us, the impact on a director’s independence in the event the related person is a director, an immediate family member of a director or an entity in which a director is a partner, shareholder or executive officer, the availability of other sources for comparable products or services, the terms of the transaction, and the terms available for similar transactions with unrelated third parties.
Meetings, Committees and CommitteesPosition Specifications of the Board of Directors
During the fiscal year ended September 30, 2011,2014, the Board held sixtwelve meetings. During this period, no incumbent member of the Board attended fewer than 75%90% of the aggregate number of meetings of the full Board and the meetings of the committees on which he or she served, and our directors attended an average of 99% of the meetings of the Board and committees on which they served. The Board has adopted position specifications applicable to members and nominees. The specifications provide, in general, that a candidate must be of sound character, be an expert in his or her chosen field, be knowledgeable of Hill-Rom’s business (or be willing to become so) and have experience as an overseer of, and advisor to, senior management. In addition, the particular skills and talents of any director nominee should positively contribute to the diversity of the various skills and talents of the Board as a whole.
The following table shows the composition of the committees of the Board:Board, all of which operate pursuant to written charters:
Director | Audit Committee | Nominating/ Corporate Governance Committee | Compensation Committee | Mergers and Acquisitions Committee |
| Rolf A. Classon (Board Chair) (I) | ü | ü | C | |
| John J. Greisch | ü | |||
| William G. Dempsey (I) | ü | |||
James R. Giertz (I) | ü | |||
| Charles E. Golden (I) | C | ü | ü | |
| William H. Kucheman (I) | ü | ü | ||
| Ronald A. Malone (I) | ü | C | ü | |
| Eduardo R. Menascé (I) | ü | |||
| Joanne C. Smith, M.D.* (I) | C | ü | ||
| Number of Meetings in FY 2014 | 8 | 6 | 6 | 8 |
I = Independent Director
C = Committee Chair
The Audit Committee has general oversight responsibilities with respect to Hill-Rom’s financial reporting and controls, and legal, regulatory and ethical compliance. It regularly reviews Hill-Rom’s financial reporting process, its system of internal control over financial reporting, legal and regulatory compliance and ethics, that management or the Board has established and the internal and external audit processes of Hill-Rom. The Audit Committee operates pursuant to a written charter, and during the fiscal year ended September 30, 2011, held nine meetings.processes. Each member of the Audit Committee is independent under Rule 10A-3 of the SEC and NYSE listing standards and meets the financial literacy guidelines established by the Board in the Audit Committee Charter. The Board of Directors has determined that each of Messrs. Golden, MenascéGiertz, Kucheman, and GiertzMenascé is an “audit committee financial expert” as that term is defined in Item 407(d) of Regulation S-K.
The Compensation Committee assists the Board in ensuring that the officers and key management of Hill-Rom are effectively compensated in terms of salaries, supplemental compensation and other benefitsa way that areis internally equitable and externally competitive. The Compensation Committee is also responsible for reviewing and assessing the talent development and succession management actions concerning the officers and key employees of Hill-Rom. The Compensation Committee operates pursuant to a written charter, and during the fiscal year ended September 30, 2011, held four meetings.
The Nominating/Corporate Governance Committee assists the Board in ensuring that Hill-Rom is operated in accordance with prudent and practical corporate governance standards, ensuring that the Board achieves its objective of having a majority of its members be independent in accordance with NYSE listing standards, and other regulations and identifying candidates for the Board of Directors. It also assists the Audit Committee with Hill-Rom’s non-financial compliance oversight. The Nominating/Corporate Governance Committee operates pursuant to a written charter, and during the fiscal year ended September 30, 2011, held four meetings.
The Mergers and Acquisitions Committee assists the Board in reviewing potential acquisition opportunities that Hill-Rom may have.
Nomination of Directors for Election
The Nominating/Corporate Governance Committee considers director candidates recommended by shareholders, and any such recommendations should be communicated to the Chair of the Nominating/Corporate Governance Committee in the manner described above in “—Communications“Communications with Directors” and should be accompanied by substantially the same types of information as are required under Hill-Rom’s Code of By-laws for shareholder nominees.
Hill-Rom’s Code of By-Laws provides that nominations of persons for election to the Board of Directors of Hill-Rom may be made at any meeting of shareholders by or at the direction of the Board of Directors or by any shareholder entitled to vote for the election of members of the Board of Directors at the meeting. For nominations to be made by a shareholder, the shareholder must have given timely notice thereof in writing to the Secretary of Hill-Rom and any nominee must satisfy the qualifications established by the Board of Directors of Hill-RomHill-Rom. To be timely, a shareholder’s nomination must be delivered to or mailed and received by the Secretary not later than (i) in the case of the annual meeting, 100 days prior to the anniversary of the date of the immediately preceding annual meeting which was specified in the initial formal notice of such meeting (but if the date of the forthcoming annual meeting is more than 30 days after such anniversary date, such written notice will also be timely if received by the Secretary by the later of 100 days prior to the forthcoming meeting date and the close of business 10 days following the date on which Hill-Rom first makes public disclosure of the meeting date) and (ii) in the case of a special meeting, the close of business on the tenth day following the date on which Hill-Rom first makes public disclosure of the meeting date. The notice given by a shareholder must set forth: (i) the name and address of the shareholder who intends to make the nomination and of the person or persons to be nominated; (ii) a representation that the shareholder is a holder of record, setting forth the shares so held, and intends to appear in person or by proxy as a holder of record at the meeting to nominate the person or persons specified in the notice; (iii) a description of all arrangements or understandings between such shareholder and each nominee proposed by the shareholder and any other person or persons (identifying such person or persons) pursuant to which the nomination or nominations are to be made by the shareholders; (iv) such other information regarding each nominee proposed by such shareholder as would be required to be included in a proxy statement filed pursuant to the proxy rules of the SEC; (v) the consent in writing of each nominee to serve as a director of Hill-Rom if so elected; and (vi) a description of the qualifications of such nominee to serve as a director of Hill-Rom.
Compensation Committee Interlocks and Insider Participation
During the fiscal year ended September 30, 2011,2014, the following directors served on the Compensation Committee: Ronald A. Malone, Joanne C. Smith, M.D. and, Rolf A. Classon.Classon and William G. Dempsey, who joined the Compensation Committee after he was elected to the Board of Directors at last year’s annual meeting on March 7, 2014. The Compensation Committee had no interlocks or insider participation.
Availability of Governance Documents
Copies of Hill-Rom’s Corporate Governance Standards, Global Code of Ethical Business Conduct and Board committee charters are available on the Investor Relations section of the Hill-Rom’s website at www.hill-rom.comhttp://ir.hill-rom.com or in print to any shareholder who requests copies through Hill-Rom’s Investor Relations office. Also available on Hill-Rom’s website are position specifications adopted by the Board for the positions of Chief Executive Officer Chair and Vice Chair of the Board of Directors and its committees, and other members of the Board of Directors.
The Audit Committee is comprised entirely of independent directors (as defined for members of an audit committee under NYSE listing standards and SEC audit committee structure and membership requirements) and operates in accordance with a written charter adopted by the Board of Directors. The Board of Directors has determined that each of Golden, Giertz, Kucheman and Menascé is an "audit committee financial expert" as that term is defined in Item 407(d) of Regulation S-K of SEC.
Management is responsible for Hill-Rom’s internal controls, financial reporting process and compliance with laws and regulations and ethical business standards. The independent registered public accounting firm is responsible for performing an integrated audit of Hill-Rom’s consolidated financial statements and its internal control over financial reporting in accordance with standards of the Public Company Accounting Oversight Board (“PCAOB”) and the issuance of a report thereon. The Audit Committee of the Board of Directors (the “Committee”) has the responsibility to monitor and oversee these processes.
The Committee meets separately at most regular committee meetings with management, the Vice President of Internal Audit and Hill-Rom’s outside independent registered public accounting firm. The Committee has the authority to conduct or authorize investigations into any matters within the scope of its responsibilities and the authority to retain such outside counsel, experts, and other advisors as it determines appropriate to assist it in the conduct of any such investigation. In addition, the Committee approves, subject to shareholder ratification, the appointment of Hill-Rom’s outside independent registered public accounting firm, PricewaterhouseCoopers LLP (“PwC”), and pre-approves all audit and non-audit services to be performed by the firm.
The Committee has reviewed and discussed the consolidated financial statements with management and PwC. Management represented to the Committee that Hill-Rom’s consolidated financial statements were prepared in accordance with generally accepted accounting principles. PwC discussed with the Committee matters required to be discussed by Statement on Auditing Standards No. 114 (The Auditor’s Communication With Those Charged With Governance).the PCAOB. Management and the independent registered public accounting firm also made presentations to the Committee throughout the year on specific topics of interest, including: (i) current developments and best practices for audit committees; (ii) updates on the substantive requirements of the Sarbanes-Oxley Act of 2002, including management’s responsibility for assessing the effectiveness of internal control over financial reporting; (iii) key elements of anti-fraud programs and controls; (iv) transparency of corporate financial reporting; (v) Hill-Rom’s critical accounting policies; (vi) the applicability of new and proposed accounting releases; and (vii) SEC accounting developments.committees.
PwC also provided to the Committee the written disclosures and the letter required by applicable requirements of the PCAOB regarding the independent accountant’s communications with the audit committee regarding independence. PwC informed the Audit Committee that it was independent with respect to Hill-Rom within the meaning of the securities acts administered by the SEC and the requirements of the PCAOB. The Committee discussed this finding, and also considered whether non-audit consulting services provided by PwC could impair the auditors’ independence and concluded that such services have not done so.
Based upon the forgoing,foregoing, the Committee recommended to the Board of Directors that the audited consolidated financial statements be included in Hill-Rom’s Annual Report on Form 10-K for the year ended September 30, 2011.2014.
In addition, the Committee has discussed with the Chief Executive Officer and the Chief Financial Officer of Hill-Rom the certifications required to be given by such officers in connection with Hill-Rom’s Annual Report on Form 10-K pursuant to the Sarbanes-Oxley Act of 2002 and SEC rules adopted thereunder, including the subject matter of such certifications and the procedures followed by such officers and other management in connection with the giving of such certifications.
Submitted by the Audit Committee
Charles E. Golden (Chair)
Eduardo R. Menascé (Vice Chair)
James R. Giertz
The following table sets forth information with respect to the beneficial ownership of our outstanding common stock as of December 30, 201131, 2014 by:
| · | each of our directors and our Named Executive Officers; |
| · | all of our directors and executive officers as a group; and |
| · | each person or entity |
Our common stock is our only class of equity securities outstanding. Except as otherwise noted in the footnotes below, the individual director or executive officer or their family members had sole voting and investment power with respect to such securities. None of the shares beneficially owned by our directors and executive officers are pledged as security. The number of shares beneficially owned includes, as applicable, directly and/or indirectly owned shares of common stock, common stock shares underlying stock options that are currently exercisable or will become exercisable within 60 days from December 30, 2011,31, 2014, and deferred stock share awards (otherwise known as restricted stock units or RSUs) that are vested or will vest within 60 days from December 30, 2011.31, 2014. Except as specified below, the business address of the persons listed is our headquarters, 1069 State Route 46 East, Batesville, Indiana 47006.
Name of Beneficial Owner | Shares Owned Directly(2) | Shares Owned Indirectly | Shares Under Options/RSUs Exercisable/ Vesting Within 60 Days | Total Number of Shares Beneficially Owned | Percent of Class | ||||
Directors and Named Executive Officers: | |||||||||
| Rolf A. Classon | 15,806 | - | 61,236 | 77,042 | * | ||||
| John J. Greisch | 30,000 | - | 147,749 | 177,749 | * | ||||
| James R. Giertz | 2,000 | - | 6,546 | 8,546 | * | ||||
| Charles E. Golden | 3,299 | - | 39,180 | 42,479 | * | ||||
| W August Hillenbrand | 152,972 | 916,302 | 29,222 | 1,098,496 | 1.8% | ||||
| Ronald A. Malone | - | - | 14,578 | 14,578 | * | ||||
| Eduardo R. Menascé | - | - | 18,006 | 18,006 | * | ||||
| Katherine S. Napier | - | - | 7,403 | 7,403 | * | ||||
| Joanne C. Smith, M.D. | 2,000 | - | 27,788 | 29,788 | * | ||||
| Martha G. Aronson | 5,946 | 5,000 | 10,280 | 21,226 | * | ||||
| Mark J. Guinan | 12,132 | - | 17,060 | 29,192 | * | ||||
| Alejandro Infante Saracho | 5,182 | - | 11,034 | 16,216 | * | ||||
| Susan R. Lichtenstein | 1,000 | - | 12,503 | 13,503 | * | ||||
Gregory N. Miller (1) | 36,452 | - | 0 | 36,452 | * | ||||
All directors and executive officers as a group (21 individuals) | 245,980 | 921,302 | 475,809 | 1,643,091 | 2.6% | ||||
Name of Beneficial Owner | Shares Owned Directly(1) | Shares Owned Indirectly | Shares Under Options/RSUs Exercisable/ Vesting Within 60 Days | Total Number of Shares Beneficially Owned | Percent of Class |
| Directors and Named Executive Officers: | |||||
| Rolf A. Classon | 15,806 | - | 65,097 | 80,903 | * |
| John J. Greisch | 72,478 | - | 577,927 | 650,405 | 1.1% |
| William G. Dempsey | - | - | 3,989 | 3,989 | * |
| James R. Giertz | 2,000 | - | 18,852 | 20,852 | * |
| Charles E. Golden | 6,464 | - | 41,093 | 47,557 | * |
| William Kucheman | - | - | 8,263 | 8,263 | * |
| Ronald A. Malone | - | - | 27,200 | 27,200 | * |
| Eduardo R. Menascé | - | - | 30,853 | 30,853 | * |
| Joanne C. Smith, M.D. | 2,000 | - | 41,093 | 43,093 | * |
| Susan R. Lichtenstein | 11,855 | - | 98,953 | 110,808 | * |
| Michael S. Macek | 3,648 | - | 7,336 | 10,984 | * |
James K. Saccaro (2) | - | - | - | - | * |
Alejandro Infante Saracho (3) | 14,934 | - | 82,779 | 97,713 | * |
| Alton E. Shader | 7,642 | - | 33,851 | 41,493 | * |
All directors and executive officers as a group (18) | 153,079 | - | 1,080,403 | 1,233,482 | 2.1% |
Name of Beneficial Owner | Total Number of Shares Beneficially Owned | Percent of Class | |||
Other 5% Beneficial Owners: | |||||
Boston, MA | |||||
BlackRock Inc. 40 East 52nd Street New York, NY 10022 | 3,378,967 (5) | 6.0% | |||
The Vanguard Group
3,342,331 (6) | 5.9% | ||||
SouthernSun Asset Management LLC 6070 Popular Ave Suite 300 Memphis, TN 38119 | 3,190,144 (7) | 5.6% |
20 * Less than 1% of the total shares outstanding. |
| (1) |
| Includes shares of common stock purchased under our employee stock purchase plan over the first quarter of fiscal year |
| (2) | Mr. Saccaro left Hill-Rom on July 3, 2014; shareholdings based on most recent available information. |
| (3) | Mr. Infante Saracho left Hill-Rom on December 31, 2014; shareholdings based on most recent available information |
| (4) | This information is based solely on Schedule 13F filed by Fidelity Management & Research Co. with the SEC on November 14, 2014. |
| (5) | This information is based solely on Schedule 13F filed by BlackRock, Inc. with the SEC on |
| This information is based solely on Schedule 13F filed by |
21
COMPENSATION DISCUSSION AND ANALYSIS |
Compensation Committee Report The Compensation and Management Development Committee of the Board of Directors of Hill-Rom Holdings, Inc. has reviewed and discussed the Compensation Discussion and Analysis contained in this proxy statement with management and, based upon this review and discussion, recommended to the Board of Directors that the Compensation Discussion and Analysis be included in this proxy statement and the Company’s annual report on Form 10-K for the fiscal year ended September 30, 2014. The Compensation and Management Development Committee Ronald A. Malone (Chair) Rolf A. Classon Joanne C. Smith, M.D. William G. Dempsey |
Contents of the Compensation Discussion and Analysis
| Named Executive Officers | |
| Goals of Our Compensation Program | 23 |
| Links Between Executive Compensation and Company Performance | 23 |
| Compensation of John Greisch, Our | 24 |
| At-Risk Pay | 24 |
| CEO Reported vs. Realized Pay | 25 |
| Key Governance Features Relating to Executive Compensation | 25 |
| Elements of Executive Compensation | 26 |
| Base Salary | 26 |
| Annual Cash Incentive | 27 |
| Long-Term Equity Awards | 28 |
| Retirement and | 30 |
| Other Personal Benefits | 31 |
| Employment Agreements | 31 |
| Role of the Compensation Committee | 32 |
| Peer Group and Survey Data | 32 |
| Peer Group Companies | 32 |
| Other Factors | 33 |
| Compensation Consultant | 33 |
| Risk Assessment | 33 |
***Our Key Achievements for fiscal year 2014 can be found in our
executive summary on page 1 of the proxy statement***
22
Named Executive Officers
This Compensation Discussion and Analysis (“CD&A”) describes our compensation programs and how they apply to our Named Executive Officers (“NEOs”), including:
| John J. Greisch | President and Chief Executive Officer |
| James K. Saccaro* | Former Senior Vice President and Chief Financial Officer |
| Michael S. Macek* | Vice President, Treasurer and Interim Chief Financial Officer |
| Alejandro Infante Saracho* | Former Senior Vice President and President International |
| Susan R. Lichtenstein | Senior Vice President, Corporate Affairs, Chief Legal Officer & Corporate Secretary |
| Alton E. Shader | Senior Vice President and President North America |
Goals of Our Compensation Program
Hill-Rom’s compensation program is designed to:
| · | Align management’s interests with those of shareholders; |
| · | Motivate and provide incentive for employees to achieve superior results; |
| · | Ensure clear accountabilities and provide rewards for producing results; |
| · | Ensure competitive compensation in order to attract and retain superior talent; and |
| · | Ensure simplicity and transparency in compensation structure. |
Hill-Rom’s compensation program has generally targeted the 50th50th percentile of compensation paid by companies with which Hill-Rom competes for executive talent. However, the Compensation Committee believes that it is critical to retain flexibility in setting compensation when competing for the top executive talent necessary to grow Hill-Rom’s business and increase stockholdershareholder value, and has indicated that it will exceed this target when necessary. In addition, because Hill-Rom utilizes performance-based compensation, in any given year total compensation can vary when pre-established business and/or personal criteria targets are exceeded or are not achieved. Accordingly, a significant portion of our executives’ compensation is at risk and tied to the achievement of pre-established corporate financial objectives.
Links Between Executive Compensation and Company Performance
| · | Executive compensation is comprised of (1) base salary, (2) variable cash incentive awards (Short Term Incentive Compensation or STIC) and (3) long-term, equity-based incentive awards (Long-Term Incentives or LTI). |
23
| · | The Compensation Committee generally targets total compensation at the 50th percentile of compensation paid by our peer group. |
| · | Our variable cash incentive award was based on two metrics in fiscal 2014: revenue and adjusted earnings per share. These same metrics will be used in fiscal 2015. |
| · | As shown below, the significant majority of our CEO’s compensation is tied to company performance, and the actual pay realized by our CEO is substantially less than that reported in the summary compensation table. |
| · | A summary of our key achievements for fiscal year 2014 can be found in the executive summary of this proxy statement on page 1. |
Compensation of John Greisch, Our CEO
While our Compensation Committee works to align the pay of all of our executives to the interests of our shareholders, they believe that it is especially important in the case of our Chief Executive Officer, John Greisch. Accordingly, the Compensation Committee has selected a mix of pay for DeterminingMr. Greisch which is heavily weighted towards annual bonuses and long-term equity based compensation, and away from base salary, so much so that 85% of Mr. Greisch’s targeted compensation for fiscal year 2015 is at-risk. This is significantly higher than the at-risk portion of the target compensation of our other named executive officers. Moreover, the at-risk nature of his compensation is demonstrated by the PSU grants made to Mr. Greisch in 2010 and 2011, which vested in 2013 and 2014 at levels of 0% and 57%, respectively. Additionally, Mr. Greisch’s annual bonus for fiscal year 2014 was paid at a level of only 73% to target.
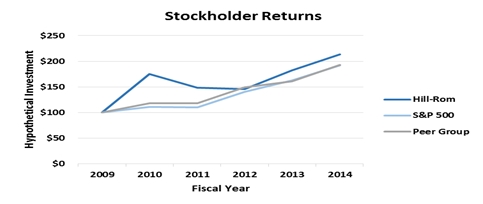
The Compensation Committee also recognizes that in extraordinary circumstances, it is appropriate to issue longer term retention awards to executives who have made substantial contributions in enhancing shareholder value to ensure they remain with Hill-Rom to consolidate and accelerate those gains. As shown by the stockholder returns graph on page 1 of our executive summary, Hill-Rom has substantially outpaced both our peer group and the S&P 500 over the last five years, a period that coincides with Mr. Greisch’s tenure with Hill-Rom. Accordingly, to ensure the continuity of future leadership, the Compensation Committee made a non-recurring RSU grant in fiscal year 2014 to Mr. Greisch in the amount of $2 million, half of which vests in three years, and half of which vests in five years. The Compensation Committee believes that these grants will help to ensure that Mr. Greisch remains with Hill-Rom to continue to provide shareholder returns in excess of the market over time.
FY 2015 Target CEO Compensation Summary | FY 2015 Target Continuing NEOs Compensation Summary |
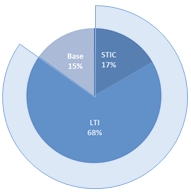 | 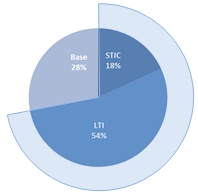 |
| Total at Risk: 85% | Total at Risk: 72% |
24
*Continuing NEOs are Ms. Lichtenstein and Mr. Shader
CEO Reported Pay vs. Realized Pay
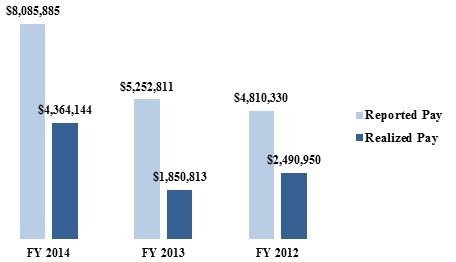 |
| *Realized pay includes, with respect to any fiscal year, salary and cash bonus actually paid in such year, the fair value of stock awards vesting in such year, the gain from any exercised stock options, and the value of other perquisites received. |
Key Governance Features Relating to Executive Compensation
The Hill-Rom Board has instituted a number of corporate governance features related to executive compensation, which are highlighted below and described more fully later.
| What We Do | What We Don’t Do | ||
Require significant stock ownership, including 6X base salary for our CEO, ensuring that executives are invested in Hill-Rom’s long-term success |  | We don’t re-price stock options or buy-back equity grants | |
 | Have an effective, 24 month clawback policy in place in the event of executive misconduct resulting in a material restatement in our financial statements | | We don’t provide any gross-ups for perquisites or excise taxes, such as 280G taxes in the event of a change of control, other than certain relocation expenses |
| | Engage a fully independent compensation consultant | | We don’t provide single-trigger change in control agreements |
| | Our executives have at-will employment agreements | | We don’t allow executives to hedge or pledge their Hill-Rom stock, unless explicitly approved by the Board |
25
Elements of Executive Compensation
The major components of Hill-Rom’s executive officer compensation are summarized below:
| Element | Purpose | Key Characteristics |
| Base Salary | Reflects each executive’s base level of responsibility, qualifications and contributions to the company | Fixed compensation that is reviewed and, if appropriate, adjusted annually |
Variable Cash Incentive - STIC Award | Motivates our executives to achieve annual company objectives that the Board believes will drive long-term growth in shareholder value | This annual cash bonus is earned by achieving designated levels of revenue and adjusted EPS; payouts are adjusted for individual performance |
Long-term, Equity Incentive - PSU Award | Motivates our executives by directly linking their compensation to the value of our stock relative to our peer group | The ultimate number of units earned is based on free-cash flow, as adjusted by our total shareholder return as compared to our custom peer group plus the S&P 400 MidCap Health Care Index (fiscal 2014) or the Morgan Stanley Health Care Index (fiscal 2015) |
Long-term, Equity Incentive - RSU Award | Motivates our executives by tying compensation to long-term stock appreciation; additionally, the time-vesting nature of the awards helps enable executive retention | Long-term restricted stock units vest on a three year cliff basis (other than certain sign-on awards) |
Long-term, Equity Incentive - Stock Options | Motivates our executives by linking their compensation to appreciation in our stock price | Stock options vest 25% per year over a four year period |
Base Salary
Hill-Rom provides senior management a base salary that is competitive and consistent with their positions, skill levels, experience, knowledge and length of service with Hill-Rom. Base salary is intended to aid in the attraction and retention of talent in a competitive market and is generally targeted at the market median, although actual salaries may be higher or lower as a result of various factors, including those given above as well as individual performance, internal pay equity within Hill-Rom and the degree of difficulty in replacing the individual.
The base salaries of senior management are reviewed by the Compensation Committee on an annual basis, generally during the first quarter of the fiscal year, as well as at the time of promotion or significant changes in responsibility. Executives are eligible for base salary increases based on individual performance, as well as market benchmarking that helps the Compensation Committee assess the Company’s competitiveness for talent. Individual performance is determined by use of an internal performance management system, which differentiates individual achievement. Market benchmarking is done via the Compensation Committee’s independent consultant, as well as with reference to publicly reported compensation data. For fiscal year 2015, the Compensation Committee granted the following increases which reflect the Committee’s assessment of the executives’ performance during the preceding year, as well as the Compensation Committee’s consideration of market benchmarking for similarly placed executives:
26
Name* | 2014 Salary | 2015 Salary | % Increase | |||||||||
| John J. Greisch | $ | 965,000 | $ | 1,000,000 | 3.6 | % | ||||||
| Susan R. Lichtenstein | $ | 453,614 | $ | 464,000 | 2.3 | % | ||||||
| Alton E. Shader | $ | 420,240 | $ | 430,000 | 2.3 | % | ||||||
| *Table represents continuing NEOs only. | ||||||||||||
Annual Cash Incentives
Overview. All named executive officers participate in our Incentive Plan, which is designed to comply with the requirements of Section 162(m) of the Internal Revenue Code of 1986 for performance-based compensation. The Incentive Plan provides for a maximum award equal to 2.0% of our EBITDA (as adjusted) for our CEO and 1.0% for each other named executive officer. However, in determining actual awards made under the plan, the Compensation Committee has the discretion to, and has in the past, paid actual awards which are lower than the maximum awards. The committee exercises this negative discretion by reference to the Company wide Short-Term Incentive Compensation Plan (the “STIC Plan”), which is discussed herein. The objective of the STIC Plan is to provide a total level of cash compensation that involves the achievement of internal performance objectives, which take into consideration the competitive market median of total cash compensation.
Each named executive officer receives a target award that (1) is adjusted upwards or downwards based on achieving Company-wide targets, which set the STIC Funding Percentage, and (2) may be adjusted upwards or downwards based on individual targets and measures. To the extent that compensation under the Incentive Plan exceeds the compensation that the executive would have been paid under the STIC Plan, the committee has in the past reduced the payment under the Incentive Plan to match the hypothetical payment under the STIC Plan.
STIC Payment Calculation. The final STIC Plan payment to any individual is calculated by multiplying (a) the STIC Funding Percentage by (b) the Individual STIC Performance by (c) the STIC Target Opportunity by (d) base salary.
STIC Funding Percentage. Under the terms of the STIC Plan, the Compensation Committee establishes a STIC Plan pool each year that is funded based upon the achievement of pre-established performance objectives. The STIC Plan pool is generally funded at between 30% and 150% of aggregate target opportunities.
For fiscal year 2014, the targets and achievements (in millions, except per share data) were as follows:
| STIC Targets and Achievement Calculation | ||||||
Threshold | Target | Maximum | Weight | Actual | Achievement | |
| Revenue | $1,564 | $1,738 | $1,911 | 40% | $1,658 | 95.4% |
| Adjusted EPS* | $2.13 | $2.51 | $2.89 | 60% | $2.21 | 61.8% |
| Total Weighted Average Achievement** | 73% | |||||
*Adjusted for the impact of acquisitions and various one-time events (such as litigation settlements, changes in policies, and certain other unusual charges or benefits) from our as-reported financial results. These amounts may differ from our reported adjusted numbers. ** Total achievement is lower than a simple weighted average calculation due to Compensation Committee discretion. | ||||||
27
The objectives are set with the intention that the relative level of difficulty in achieving the targets is consistent from year to year. In addition, in order to encourage management to take actions in the best interests of Hill-Rom, the Compensation Committee has the discretion to exclude nonrecurring special charges and amounts from the calculation of these targets. At its November 2014 meeting, the Compensation Committee reviewed the adjusted financial performance of Hill-Rom against the predetermined financial targets and determined that based on our performance in fiscal year 2014, the aggregate STIC Funding Percentage was 73%, adjusted slightly downward by the Compensation Committee from the nominal achievement level, demonstrating significant pay for performance alignment in our compensation program.
Individual STIC Performance. The Compensation Committee uses its discretion to assess achievement of individual targets. Such assessment yields an Individual STIC Performance percentage, which ranged from 75% to 150% in fiscal 2014 for our named executive officers. The individual targets and measures are targets specific to the officer’s area of responsibility, such as sales, operating income, cash flow, and demonstrated management and leadership, as appropriate.
STIC Target Opportunity. Fiscal year 2014 and 2015 opportunities, as a percentage of base salary, were:
| STIC Target Opportunities | ||
| Name | FY 2014 | FY 2015 |
| John J. Greisch | 110% | 110% |
| Susan R. Lichtenstein | 60% | 60% |
| James K. Saccaro* | 75% | N/A |
| Michael S. Macek | 40% | 40% |
| Alejandro Infante Saracho* | 70% | N/A |
| Alton E. Shader | 70% | 70% |
| * FY 2015 not applicable as participants left Hill-Rom | ||
Long-Term Equity Awards
Overview: Hill-Rom’s Stock Incentive Plan provides for the opportunity to grant stock options and other equity-based incentive awards to officers, other key employees and non-employee directors to help align those individuals’ interests with those of shareholders, to help motivate executives to make sound strategic long-term decisions, and to better enable Hill-Rom to attract and retain capable directors and executive personnel.
Hill-Rom’s long-term incentive compensation program provides a portfolio approach to long-term incentives by providing:
| · | Awards, at target, that are aligned with competitive market levels; |
| · | Payouts that correlate with high performance resulting in increased payouts and low performance resulting in reduced payouts; |
| · | A mix of awards representative of typical market practice; and |
| · | Awards that support internal equity among Hill-Rom’s executives. |
In addition, the Compensation Committee considered the Stock Incentive Plan share usage rate, number of plan participants and potential aggregate target awards for participants in the process of determining target award levels and the mix of long-term incentive awards.
28
LTI Target Opportunity. Fiscal year 2014 and 2015 opportunities, as a percentage of base salary, were and are:
| LTI Target Opportunities | ||
| Name | FY 2014 | FY 2015 |
| John J. Greisch | 400% | 450% |
| Susan R. Lichtenstein | 175% | 175% |
| James K. Saccaro* | 200% | N/A |
| Michael S. Macek | 60% | 60% |
| Alejandro Infante Saracho* | 175% | N/A |
| Alton E. Shader | 175% | 175% |
| * No grant provided for FY 2015 as participants left Hill-Rom | ||
Stock Options and RSUs. Our RSUs generally vest on a three-year cliff basis, and our stock options generally vest in four equal annual installments.
Performance Based Share Units or PSUs. These awards provide the opportunity to earn shares of Hill-Rom stock based on achievement of performance objectives and completion of a three-year vesting period. For the PSU awards granted in fiscal years 2012 and 2013, vesting was and is based on relative TSR, a stock performance metric based upon share price appreciation and dividends paid to our shareholders. Fiscal Year 2012 PSU grants vested in November 2014 at a level of 57% of target achievement, again demonstrating pay for performance alignment in our compensation program. For Fiscal Year 2014 and 2015 PSU vesting is based on the level of achievement (between 0% and 150% of target) against a one-year adjusted free cash flow metric, as further modified by TSR achievement (from 50% to 150%) over the three-year vesting period. Consequently, in both cases ultimate PSU value will vary depending on Hill-Rom’s TSR during the three year performance period as compared to a peer group of other companies. Until fiscal 2015, our PSU peer group was comprised of the companies used to evaluate our overall compensation levels plus the S&P Mid-Cap Health Care Index Companies. In fiscal year 2015, we replaced the S&P Mid-Cap Health Care Index Companies with the Morgan Stanley Health Care Index, which the Compensation Committee believed was a better overall industry fit, since it included more of Hill-Rom’s custom peer group, as well as more companies directly sharing Hill-Rom’s industry classification.
| Fiscal Year 2013 PSU Grants | |
Company’s TSR over Three Year Performance Period | % of Target Award Vested |
Less than 25th percentile | 0% |
25th percentile* | 50% |
35th percentile | 64% |
45th percentile | 79% |
50th percentile | 86% |
60th percentile** | 100% |
| *Awards between 25th and 60th percentile are made based on a straight-line interpolation. **Performance above 60th percentile may be awarded bonus shares up to 100% of the target amount at the discretion of the Compensation Committee | |
29
| Fiscal Year 2014 and 2015 PSU Grants | |||
| Performance Level | Free Cash Flow Achievement Modifier | Relative TSR Achievement Modifier* | Total Performance Modifier |
| Below Threshold | 0% | 50% | 0% |
| Threshold | 50% | 50% | 25% |
| Target | 100% | 100% | 100% |
| Maximum | 150% | 150% | 225% |
| *Modifies one-year adjusted free cash-flow achievement based on three-year TSR measurement period. Modifiers between the threshold and maximum percentile amounts are based on straight-line interpolation. |
Share Ownership Guidelines. In order to align the interests of executives to the long-term performance of the Company, executive officers are required to own a certain amount of Hill-Rom stock within five years of joining the Company. The Chief Executive Officer is required to achieve ownership of Hill-Rom common stock valued at six times annual base salary, which we recently increased from our previous requirement of four times base salary. Each of the other executive officers is generally required to achieve ownership of Hill-Rom common stock valued at two times annual base salary, in each case within five years of becoming an executive officer. Shares owned outright and RSUs count toward the required ownership level. This requirement, like the Executive Compensation Recoupment Policy discussed below, helps ensure long-term focus and appropriate levels of risk-taking by executive officers. Other than Mr. Greisch, who has achieved his required ownership level, none of our executive officers have been with the Company for more than five years, and therefore are not required to meet these guidelines. However, all are on their way to accruing the shares to meet the target by their five year anniversaries.
Hill-Rom’s Compensation Recoupment Policy. Under our Compensation Recoupment Policy, the Compensation Committee can recoup from an executive officer all performance-based compensation and any trading profits on trades in Hill-Rom securities received during the prior 24 months in the event there is a material restatement of financial results due to misconduct of the executive officer from whom recoupment is sought. The Policy gives the Compensation Committee discretion to determine whether and to what extent to seek recoupment based on specific facts and circumstances.
Timing of Equity Grants. We generally make all equity grants to our executives on an annual basis (except in the case of a new hire or promotion), and these grants have historically been made at our November Board meeting. Consequently, they are made approximately two weeks after the release of our fiscal year-end financial results.
Anti-Hedging/Anti-Pledging Policy. Hill-Rom has adopted an insider trading policy which incorporates anti-hedging and anti-pledging provisions. Consequently, no employee, officer or director may enter into a hedge or pledge of Hill-Rom stock. Any exception to this policy must be made by requesting a waiver from the entire Board, and such request must (1) be submitted at least thirty (30) days in advance of the proposed transaction date, (2) contain the relevant transaction documents and a summary thereof, and (3) contain a justification for the request. The Board has never granted a waiver under this policy.
Re-pricing and Buybacks. Hill-Rom does not re-price options, nor does it buy-back shares (other than with respect to taxes and the exercise price upon the vesting of equity awards).
Retirement and Change in Control Agreements
Overview. Hill-Rom believes that it is in the best interests of it and its shareholders to have the unbiased dedication of its executives, without the distraction of personal uncertainties such as retirement or a change in control. Hill-Rom has designed its senior management retirement and other post-employment benefit programs to reduce such distraction. We also believe that these benefits are at market levels and competitive with those of other comparable companies. In addition to our Company-wide retirement programs (including our 401(k) and our pension plan, which has stopped taking new entrants), we have several other programs in place.
30
Normal Retirement Guidelines. Executives who are at least 55 years of age and with 5 years length of service are eligible to receive certain benefits under Hill-Rom’s Stock Incentive Plan. These guidelines are incorporated into each individual equity award agreement and have been approved by the Compensation Committee. The following is allowed upon retirement:
| · | accelerated vesting of outstanding time-based RSUs and stock options, which have been held for at least one year; |
| · | partial vesting of outstanding PSUs and/or performance-based stock options, which have been held for at least one year and for which performance objectives have been achieved; and |
| · | an extension of up to three years of the time to exercise eligible outstanding stock options. |
Supplemental Executive Retirement Plan. The Hill-Rom Holdings, Inc. Supplemental Executive Retirement Plan (the “SERP”) provides additional retirement benefits to certain employees selected by the Compensation Committee whose retirement benefits under our Company-wide pension plan or 401(k) plan are reduced, curtailed or otherwise limited as a result of certain limitations under the Internal Revenue Code of 1986.
Change in Control Agreements. Hill-Rom has a Change in Control agreement in place with each Named Executive Officer other than Mr. Macek. These change in control agreements are of the form commonly referred to as “double-trigger” agreements, in that they are triggered only in the event that an executive is terminated in connection with a change in control, not merely if a change in control occurs. Moreover, they do not contain any 280G gross-up provisions. They are intended to encourage continued employment by Hill-Rom of its key management personnel and to allow such personnel to be in a position to provide assessment and advice to the Board of Directors regarding any proposed change in control without concern that such personnel might be unduly distracted by the uncertainties and risks created by the proposed transaction. In addition, certain long-term equity awards that our executives hold may vest upon a change of control, even if the executive is not terminated. The terms of this vesting are controlled by the applicable equity award agreements and not by the change in control agreements. For information on the potential payments to executives on a change of control, see “Potential Payments Upon Termination or Change in Control”.
Other Personal Benefits
In addition to the elements of compensation discussed above, we also provide senior level management with various other benefits in order to remain competitive with the market, in attracting and retaining qualified executives. Hill-Rom believes that these benefits are in-line with the market, are reasonable in nature, are not excessive and are in the best interest of Hill-Rom and its shareholders. None of our NEOs receive any excise tax or prerequisite gross-ups, other than potentially for reasonable relocation costs as applicable.
Employment Agreements
We have entered into an employment agreement with each of our Named Executive Officers. We believe that it is appropriate for our senior executives to have employment agreements because they provide certain contractual protections to us that we might not otherwise have, including provisions relating to non-competition with us, non-solicitation of our employees and confidentiality of our proprietary information. Additionally, we believe that employment agreements are a useful tool in recruiting and retention of senior level employees. The current employment agreements set forth the basic duties of the executive officers and provide that each executive officer is entitled to receive, in addition to base salary, incentive compensation payable in our discretion and such additional compensation, benefits and perquisites as we may deem appropriate. The employment agreements are terminable by either us or the executive officer “without cause” on sixty (60) days’ written notice, or if terminated by us, pay in lieu of notice, and are terminable at any time by us for cause, as defined in each employment agreement. See “Potential Payments Upon Termination or Change in Control” for further information regarding payments due upon termination. The employment agreements also contain non-competition and non-solicitation agreements of the executive officers, which continue generally for a period of eighteen to twenty-four months after the termination of the executive officer’s employment.
31
Role of the Compensation Committee
The Board’s Compensation Committee is charged with ensuring that Hill-Rom’s compensation programs meet the objectives outlined above. In that role, the Compensation Committee makes all executive compensation decisions, administers Hill-Rom’s compensation plans and keeps the Board informed regarding executive compensation matters. The Compensation Committee, in consultation with Hill-Rom’s independent compensation consultant and the full Board, determines the compensation of the Chief Executive Officer. The Chief Executive Officer makes recommendations to the Compensation Committee regarding the compensation of his direct reports, including Hill-Rom’s other Named Executive Officers. From time to time, Hill-Rom management also provides recommendations to the Compensation Committee regarding modificationschanges to the elements and structure of Hill-Rom’s compensation program.
The Compensation Committee considers peer group data, survey data and other factors when determining the elements and amounts of compensation. The Compensation Committee also considers the results of the annual advisory ‘say-on-pay’ proposal and incorporates such results as one of the factors considered in connection with the discharge of its responsibilities, although no factor is assigned a quantitative weighting. Because a substantial majority (98% of our stockholders excluding abstentions and non-votes) approved the compensation program described in our proxy statement in 2014, the Committee did not implement changes to our executive compensation program as a result of the stockholder advisory vote.
Peer Group and Survey Data.
As one of several factors in considering approval of elements of Hill-Rom’s compensation programs, the Compensation Committee compares Hill-Rom’s compensation programs and performance against an approved peer group of companies. The compensation peer group, which is periodically reviewed and updated by the Compensation Committee, consists of companies that are similar in size and in similar industries as Hill-Rom and with whom Hill-Rom may compete for executive talent. This peer group is a custom selected peer group and does not include the stock index companies used to calculate TSR for our PSU grants.
The Compensation Committee selected the following peer group with the assistance of its independent compensation consultant Mercer (US) Inc. (“Mercer”), focusing on companies whose revenues were one-halfcomparable to two times Hill-Rom’s planned revenue. In November 2011, theHill-Rom’s. The Compensation Committee updatedreviews the peer group as indicated belowannually. Hill-Rom’s annual revenue is approximately equal to eliminate two companies that were acquired, eliminate one non-healthcare company, and to increase the numbermedian revenue of companies in the peer group. After reviewing, there were no changes to the peer group.
Peer Group Companies | |
| Alere Inc. | |
| C. R. Bard, Inc. | |
CareFusion Corp. | |
Chemed Corp. | PerkinElmer, Inc. |
| Conmed Corporation | ResMed Inc. |
| Dentsply International Inc. | Sirona Dental Systems Labs, Inc. |
| Edwards Lifesciences Corporation | Steris Corporation |
Hologic, Inc | Teleflex, Inc. |
| Hospira, Inc. | The Cooper Companies, Inc. |
IDEXX Laboratories, Inc. | Varian Medical Systems, Inc. |
| Integra Lifesciences Holdings Corporation | West Pharmaceutical Services, Inc. |
Zimmer Holdings, Inc. | |
32
In addition to peer group data, the Compensation Committee considers survey data that include a broad sample of Fortune 1000 companies, focusing primarily on companies with revenues within a range of one-halfcomparable to two times Hill-Rom’s, or its business units’ revenue, companies in the manufacturing industry and companies with a comparable number of full time equivalent employees. The purpose of the survey data is to provide an additional source of market data to validate the findings under the proxy analysis. Hill-Rom used the Mercer Benchmark Database Survey Report on Top Management Compensation for this purpose.
Other Factors.
The Compensation Committee is aware that it cannot establish total executive compensation levels solely on the basis of the median range of competitive benchmark survey data without the consideration of additional information and available analysis. Accordingly, the committee also takes into account external and internal factors when establishing the total compensation of each executive. Some of these factors include the executive’s length of service, the level of experience and responsibility, external market conditions, complexity of position, individual performance, internal pay equity within Hill-Rom and the degree of replacement difficulty. In addition, the committee periodically reviews the total compensation of Hill-Rom’s Named Executive Officers in comparison to the total compensation of its peer group companies. The purpose of this high level review is to look at all elements of compensation that are not typically captured within a total direct compensation analysis covering base salary, annual incentive, and long term incentive compensation and, if there were significant differences, to understand what elements of compensation gave rise to the differences.difference.
30
Normal Retirement Guidelines. Executives who are at least 55 years of age and with 5 years length of service are eligible to receive certain benefits under Hill-Rom’s Stock Incentive Plan. These guidelines are incorporated into each individual equity award agreement and have been approved by the Compensation Committee with additional expertise in the evaluation of Hill-Rom’s compensation practices. During the fiscal year ended September 30, 2011, the Compensation Committee retained Mercer as its compensation and benefits consulting firm.
| · |
| · |
| · |
Change in Control Agreements. Hill-Rom has a Change in Control agreement in place with each Named Executive Officer other than Mr. Macek. These change in control agreements are of the form commonly referred to as “double-trigger” agreements, in that they are triggered only in the event that an executive is terminated in connection with a change in control, not merely if a change in control occurs. Moreover, they do not contain any 280G gross-up provisions. They are intended to encourage continued employment by Hill-Rom of its key management personnel and to allow such personnel to be in a position to provide assessment and advice to the Board of Directors regarding any proposed change in control without concern that such personnel might be unduly distracted by the uncertainties and risks created by the proposed transaction. In addition, certain long-term equity awards that our executives hold may vest upon a change of control, even if the executive is not terminated. The terms of this vesting are controlled by the applicable equity award agreements and not by the change in control agreements. For information on the potential payments to executives on a change of control, see “Potential Payments Upon Termination or Change in Control”.
Other Personal Benefits
In addition to the elements of compensation discussed above, we also provide senior level management with various other benefits in order to remain competitive with the market, in attracting and retaining qualified executives. Hill-Rom believes that these benefits are in-line with the market, are reasonable in nature, are not excessive and are in the best interest of Hill-Rom and its shareholders. None of our NEOs receive any excise tax or prerequisite gross-ups, other than potentially for reasonable relocation costs as applicable.
Employment Agreements
We have entered into an employment agreement with each of our Named Executive Officers. We believe that it is appropriate for our senior executives to have employment agreements because they provide certain contractual protections to us that we might not otherwise have, including provisions relating to non-competition with us, non-solicitation of our employees and confidentiality of our proprietary information. Additionally, we believe that employment agreements are a useful tool in recruiting and retention of senior level employees. The current employment agreements set forth the basic duties of the executive officers and provide that each executive officer is entitled to receive, in addition to base salary, incentive compensation payable in our discretion and such additional compensation, benefits and perquisites as we may deem appropriate. The employment agreements are terminable by either us or the executive officer “without cause” on sixty (60) days’ written notice, or if terminated by us, pay in lieu of notice, and are terminable at any time by us for cause, as defined in each employment agreement. See “Potential Payments Upon Termination or Change in Control” for further information regarding payments due upon termination. The employment agreements also contain non-competition and non-solicitation agreements of the executive officers, which continue generally for a period of eighteen to twenty-four months after the termination of the executive officer’s employment.
31
Role of the Compensation Committee
The Board’s Compensation Committee is charged with ensuring that Hill-Rom’s compensation programs meet the objectives outlined above. In that role, the Compensation Committee makes executive compensation decisions, administers Hill-Rom’s compensation plans and keeps the Board informed regarding executive compensation matters. The Compensation Committee, in consultation with Hill-Rom’s independent compensation consultant and the full Board, determines the compensation of the Chief Executive Officer. The Chief Executive Officer makes recommendations to the Compensation Committee regarding the compensation of his reports, including Hill-Rom’s other Named Executive Officers. From time to time, Hill-Rom management also provides recommendations regarding changes to the elements and structure of Hill-Rom’s compensation program.
The Compensation Committee considers peer group data, survey data and other factors including those given abovewhen determining the elements and amounts of compensation. The Compensation Committee also considers the results of the annual advisory ‘say-on-pay’ proposal and incorporates such results as wellone of the factors considered in connection with the discharge of its responsibilities, although no factor is assigned a quantitative weighting. Because a substantial majority (98% of our stockholders excluding abstentions and non-votes) approved the compensation program described in our proxy statement in 2014, the Committee did not implement changes to our executive compensation program as a result of the stockholder advisory vote.
Peer Group and Survey Data
As one of several factors in considering approval of elements of Hill-Rom’s compensation programs, the Compensation Committee compares Hill-Rom’s compensation programs and performance against an approved peer group of companies. The compensation peer group, which is periodically reviewed and updated by the Compensation Committee, consists of companies that are similar in size and in similar industries as Hill-Rom and with whom Hill-Rom may compete for executive talent. This peer group is a custom selected peer group and does not include the stock index companies used to calculate TSR for our PSU grants.
The Compensation Committee selected the following peer group with the assistance of its independent compensation consultant focusing on companies whose revenues were comparable to Hill-Rom’s. The Compensation Committee reviews the peer group annually. Hill-Rom’s annual revenue is approximately equal to the median revenue of the peer group. After reviewing, there were no changes to the peer group.
| Peer Group Companies | |
| Alere Inc. | Intuitive Surgical, Inc. |
| C. R. Bard, Inc. | Invacare Corporation |
| CareFusion Corp. | Mednax, Inc. |
| Chemed Corp. | PerkinElmer, Inc. |
| Conmed Corporation | ResMed Inc. |
| Dentsply International Inc. | Sirona Dental Systems Labs, Inc. |
| Edwards Lifesciences Corporation | Steris Corporation |
| Hologic, Inc | Teleflex, Inc. |
| Hospira, Inc. | The Cooper Companies, Inc. |
| IDEXX Laboratories, Inc. | Varian Medical Systems, Inc. |
| Integra Lifesciences Holdings Corporation | West Pharmaceutical Services, Inc. |
| Zimmer Holdings, Inc. | |
32
In addition to peer group data, the Compensation Committee considers survey data that include a broad sample of Fortune 1000 companies, focusing primarily on companies with revenues within a range comparable to Hill-Rom’s, companies in the manufacturing industry and companies with a comparable number of full time equivalent employees. The purpose of the survey data is to provide an additional source of market data to validate the findings under the proxy analysis. Hill-Rom used the Mercer Benchmark Database Survey Report on Top Management Compensation for this purpose.
Other Factors
The Compensation Committee is aware that it cannot establish total executive compensation levels solely on the basis of the median range of competitive benchmark survey data without the consideration of additional information and available analysis. Accordingly, the committee also takes into account external and internal factors when establishing the total compensation of each executive. Some of these factors include the executive’s length of service, the level of experience and responsibility, external market conditions, complexity of position, individual performance, internal pay equity within Hill-Rom and the degree of difficulty in replacing the individual.
| Target | Weight | Actual | Achievement | |
| Revenue | $1,546 | 25% | $1,591.7 | 149.7% |
| Adjusted EPS | $2.10 | 50% | $2.24 (1) | 121.9% |
| Cash Flow ROIC | 34.7% | 25% | 39.3% | 150% (2) |
replacement difficulty. In addition, the Compensation Committee consideredcommittee periodically reviews the Stock Incentive Plan share usage rate, numbertotal compensation of plan participants and potential aggregate target awards for participants in the process of determining target award levels and the mix of long-term incentive awards.
Retirement and Change in Control Agreements
Overview. Hill-Rom believes that it is in the best interests of it and its shareholders to have the unbiased dedication of its executives, without the distraction of personal uncertainties such as retirement or a change in control. Hill-Rom has designed its senior management retirement and other post-employment benefit programs to reduce such distraction. We also believe that these benefits are at market levels and competitive with those of other comparable companies. In addition to our Company-wide retirement programs (including our 401(k) and our pension plan, which has stopped taking new entrants), we have several other programs in place.
30
Normal Retirement Guidelines. Executives who are at least 55 years of age and with 5 years length of service are eligible to receive certain benefits under Hill-Rom’s Stock Incentive Plan. These guidelines are incorporated into each individual equity award agreement and have been approved by the Compensation Committee. The following is allowed upon retirement:
| · | accelerated vesting of outstanding time-based RSUs and stock options, which have been held for at least one year; |
| · | partial vesting of outstanding PSUs and/or performance-based stock options, which have been held for at least one year and for which performance objectives have been achieved; and |
| · | an extension of up to three years of the time to exercise eligible outstanding stock options. |
Supplemental Executive Retirement Plan. The Hill-Rom Holdings, Inc. Supplemental Executive Retirement Plan (the “SERP”) provides additional retirement benefits to certain employees selected by the Compensation Committee whose retirement benefits under our Company-wide pension plan or 401(k) plan are reduced, curtailed or otherwise limited as a result of certain limitations under the Internal Revenue Code of 1986.
Change in Control Agreements. Hill-Rom has a Change in Control agreement in place with each Named Executive Officer who currently is an executive of Hill-Rom.other than Mr. Macek. These change in control agreements are of the form commonly referred to as “double-trigger” agreements, in that they are triggered only in the event that an executive is terminated in connection with a change in control, not merely if a change in control occurs. Moreover, they do not contain any excise tax280G gross-up provisions. They are intended to encourage continued employment by Hill-Rom of its key management personnel and to allow such personnel to be in a position to provide assessment and advice to the Board of Directors regarding any proposed change in control without concern that such personnel might be unduly distracted by the uncertainties and risks created by the proposed transaction. In addition, certain long-term equity awards that our executives hold may vest upon a change of control, even if the executive is not terminated. The terms of this vesting are controlled by the applicable equity award agreements and not by the change in control agreements. For information on the potential payments to executives on a change of control, see “-Potential“Potential Payments Upon Termination or Change in Control” below..
Other Personal Benefits
In addition to the elements of compensation discussed above, we also provide senior level management with various other benefits in order to remain competitive with the market, in attracting and retaining qualified executives. Hill-Rom believes that these benefits are in-line with the market, are reasonable in nature, are not excessive and are in the best interest of Hill-Rom and its shareholders.
None of our NEOs receive any excise tax or prerequisite gross-ups, other than potentially for reasonable relocation costs as applicable.
Employment Agreements
We have entered into an employment agreement with each of our Named Executive Officers. We believe that it is appropriate for our senior executives to have employment agreements because they provide certain contractual protections to us that we might not otherwise have, including provisions relating to non-competition with us, non-solicitation of our employees and confidentiality of our proprietary information. Additionally, we believe that employment agreements are a useful tool in recruiting and retention of senior level employees. The current employment agreements set forth the basic duties of the executive officers and provide that each executive officer is entitled to receive, in addition to base salary, incentive compensation payable in our discretion and such additional compensation, benefits and perquisites as we may deem appropriate. The employment agreements are terminable by either us or the executive officer “without cause” on sixty (60) days’ written notice, or if terminated by us, pay in lieu of notice, and are terminable at any time by us for cause, as defined in each employment agreement. See “-Potential“Potential Payments Upon Termination or Change in Control” below for further information regarding payments due upon termination. The employment agreements also contain limited non-competition and non-solicitation agreements of the executive officers, which continue generally for a period of eighteen to twenty-four months after the termination of the executive officer’s employment.
31
Role of the Compensation Committee
The Board’s Compensation Committee is charged with ensuring that Hill-Rom’s compensation programs meet the objectives outlined above. In that role, the Compensation Committee makes executive compensation decisions, administers Hill-Rom’s compensation plans and keeps the Board informed regarding executive compensation matters. The Compensation Committee, in consultation with Hill-Rom’s independent compensation consultant and the full Board, determines the compensation of the Chief Executive Officer. The Chief Executive Officer makes recommendations to the Compensation Committee regarding the compensation of his reports, including Hill-Rom’s other Named Executive Officers. From time to time, Hill-Rom management also provides recommendations regarding changes to the elements and structure of Hill-Rom’s compensation program.
As one of shareholders, we submitted to the shareholders a proposal that Hill-Rom provide its shareholders an annual non-binding advisory vote regarding our executive compensation. The shareholders followed the Board’s recommendation and approved an annual, non-binding advisory vote. Subsequently, the Dodd-Frank Wall Street Reform and Consumer Protection Act (and subsequent SEC rules) mandated a non-binding shareholder vote on executive compensation. We held this vote last year, along with a vote to determine how often this vote should be held. The shareholders approved the resolution on executiveseveral factors in considering approval of elements of Hill-Rom’s compensation with over 87% of shares (excluding abstentions and non-votes) being cast in favor of our executive compensation, and again adopted the Board’s recommendation that this vote be held annually. Given this high percentage of votes in favor of our executive compensation,programs, the Compensation Committee determinedcompares Hill-Rom’s compensation programs and performance against an approved peer group of companies. The compensation peer group, which is periodically reviewed and updated by the Compensation Committee, consists of companies that are similar in size and in similar industries as Hill-Rom and with whom Hill-Rom may compete for executive talent. This peer group is a custom selected peer group and does not include the stock index companies used to keepcalculate TSR for our compensation practices in place for fiscal year 2012.PSU grants.
The Compensation Committee selected the following peer group with the assistance of its independent compensation consultant focusing on companies whose revenues were comparable to Hill-Rom’s. The Compensation Committee reviews the peer group annually. Hill-Rom’s annual revenue is approximately equal to the median revenue of the peer group. After reviewing, there were no changes to the peer group.
| Peer Group Companies | |
| Alere Inc. | Intuitive Surgical, Inc. |
| C. R. Bard, Inc. | Invacare Corporation |
| CareFusion Corp. | Mednax, Inc. |
| Chemed Corp. | PerkinElmer, Inc. |
| Conmed Corporation | ResMed Inc. |
| Dentsply International Inc. | Sirona Dental Systems Labs, Inc. |
| Edwards Lifesciences Corporation | Steris Corporation |
| Hologic, Inc | Teleflex, Inc. |
| Hospira, Inc. | The Cooper Companies, Inc. |
| IDEXX Laboratories, Inc. | Varian Medical Systems, Inc. |
| Integra Lifesciences Holdings Corporation | West Pharmaceutical Services, Inc. |
| Zimmer Holdings, Inc. | |
In addition to peer group data, the Compensation Committee considers survey data that include a broad sample of Fortune 1000 companies, focusing primarily on companies with revenues within a range comparable to Hill-Rom’s, companies in the manufacturing industry and companies with a comparable number of full time equivalent employees. The purpose of the survey data is to provide an additional source of market data to validate the findings under the proxy analysis. Hill-Rom used the Mercer Benchmark Database Survey Report on Top Management Compensation for this purpose.
Other Factors
The Compensation Committee is aware that it cannot establish total executive compensation levels solely on the basis of the median range of competitive benchmark survey data without the consideration of additional information and available analysis. Accordingly, the committee also takes into account external and internal factors when establishing the total compensation of each executive. Some of these factors include the executive’s length of service, the level of experience and responsibility, external market conditions, complexity of position, individual performance, internal pay equity within Hill-Rom and the degree of replacement difficulty. In addition, the committee periodically reviews the total compensation of Hill-Rom’s Named Executive Officers in comparison to the total compensation of its peer group companies. The purpose of this high level review is to look at all elements of compensation that are not typically captured within a total direct compensation analysis covering base salary, annual incentive, and long term incentive compensation and, if there were significant differences, to understand what elements of compensation gave rise to the difference.
Compensation Consultant
The Compensation Committee engages nationally recognized outside compensation and benefits consulting firms to evaluate independently and objectively the effectiveness of and assist with implementation of Hill-Rom’s compensation and benefit programs and to provide the Compensation Committee with additional expertise in the evaluation of Hill-Rom’s compensation practices. During the fiscal year ending September 30, 2014, the Compensation Committee used ExeQuity as its executive compensation consulting firm. ExeQuity has been asked by the Compensation Committee to provide guidance on compensation proposals, including changes to compensation levels, the design of incentive plans, as well as relevant information about market practices and trends. ExeQuity is an independent compensation consultant that provided no other services to Hill-Rom other than those services provided to the Compensation Committee.
After considering the six independence factors discussed in the relevant SEC rules, the Compensation Committee determined that no conflict of interest existed pursuant to S-K 407(e)(3)(iv).
Risk Assessment
Assisted by its compensation consultant, the Compensation Committee reviewed our material compensation policies and practices applicable to our employees and executive officers. It concluded that these policies and practices do not create risks that are reasonably likely to have a material adverse effect on the Company. Key features of the compensation program supporting this conclusion include:
| · | appropriate pay philosophy, peer group and market positioning; |
| · | effective balance in cash and equity mix, short and long term focus, corporate, business unit and individual performance focus and financial and non-financial performance measurement and discretion; |
| · | compensation programs designed to avoid excessive risk-taking; and |
| · | meaningful risk mitigants, such as the stock ownership guidelines and executive compensation recoupment policies. |
33
| COMPENSATION OF NAMED EXECUTIVE OFFICERS |
The following tables and notes set forth compensation information for the fiscal years ended September 30, 2011, 20102014, 2013 and 20092012 for our Named Executive Officers.
| Change in Pension Value | ||||||||||
| Non-Equity | and Nonqualified | |||||||||
| Stock | Option | Incentive Plan | Deferred Compensation | All Other | ||||||
| Name and Principal Position | Year | Salary | Bonus (1) | Awards (2) | Awards (3) | Compensation (4) | Earnings (5) | Compensation (6) | Total | |
| JOHN J. GREISCH (7) | 2011 | $887,397 | None | $1,448,171 | $1,800,207 | $1,197,986 | - | $175,002 | $5,508,763 | |
| President and Chief Executive Officer, | 2010 | $583,014 | None | $800,004 | $1,609,819 | $879,692 | - | $134,995 | $4,007,524 | |
| Member of the Board of Directors | ||||||||||
| MARK J. GUINAN (8) | 2011 | $360,000 | $200,000 | $1,612,059 | $778,440 | $400,950 | - | $59,471 | $3,410,920 | |
| Senior Vice President and | ||||||||||
| Chief Financial Officer | ||||||||||
| MARTHA G. ARONSON (9) | 2011 | $432,429 | None | $305,176 | $379,365 | $402,807 | - | $53,391 | $1,573,168 | |
| Senior Vice President and | ||||||||||
| President North America | ||||||||||
| ALEJANDRO INFANTE SARACHO (10) | 2011 | $380,589 | None | $298,151 | $370,613 | $262,036 | - | $50,680 | $1,372,195 | |
| Senior Vice President and | ||||||||||
| President International | ||||||||||
| SUSAN R. LICHTENSTEIN (11) | 2011 | $422,254 | None | $297,995 | $370,430 | $376,228 | - | $53,978 | $1,520,885 | |
| Senior Vice President, Corporate Affairs, | 2010 | $163,726 | None | $250,002 | $201,156 | $134,750 | - | $6,225 | $755,859 | |
| Chief Legal Officer and Secretary | ||||||||||
| GREGORY N. MILLER (12) | 2011 | $100,000 | None | - | - | - | $4,950 | $497,682 | $602,632 | |
| Former Senior Vice President and Chief | 2010 | $400,000 | None | $550,030 | $203,958 | $345,668 | $3,827 | $45,447 | $1,548,930 | |
| Financial Officer and Treasurer | 2009 | $395,178 | None | $189,053 | $643,302 | $109,524 | $9,763 | $41,431 | $1,388,251 |
| Non-Equity | |||||||||||||||||||||||||||||
| Name and | Stock | Option | Incentive Plan | All Other | |||||||||||||||||||||||||
| Principal Position | Year | Salary | Bonus (1) | Awards (2) | Awards (3) | Comp. (4) | Comp. (5) | Total | |||||||||||||||||||||
| JOHN J. GREISCH | 2014 | $ | 961,923 | None | $ | 5,187,933 | $ | 963,908 | $ | 774,895 | $ | 197,226 | $ | 8,085,885 | |||||||||||||||
| President and Chief Executive Officer, | 2013 | $ | 942,644 | None | $ | 2,331,985 | $ | 952,230 | $ | 832,355 | $ | 193,597 | $ | 5,252,811 | |||||||||||||||
| Member of the Board of Directors | 2012 | $ | 920,970 | None | $ | 1,404,277 | $ | 1,850,004 | $ | 442,894 | $ | 192,185 | $ | 4,810,330 | |||||||||||||||
| MICHAEL S. MACEK (6) | 2014 | $ | 234,096 | None | $ | 236,894 | $ | 41,373 | $ | 102,940 | $ | 16,898 | $ | 632,201 | |||||||||||||||
| Vice President, Treasurer and | 2013 | $ | 208,875 | None | $ | 79,690 | $ | 32,542 | $ | 84,841 | $ | 10,627 | $ | 416,575 | |||||||||||||||
| Interim Chief Financial Officer | |||||||||||||||||||||||||||||
| JAMES K. SACCARO (7) | 2014 | $ | 238,846 | $ | 250,000 | $ | 2,013,847 | $ | 230,001 | $ | 0 | $ | 35,107 | $ | 2,767,801 | ||||||||||||||
| Former Senior Vice President and | |||||||||||||||||||||||||||||
| Chief Financial Officer | |||||||||||||||||||||||||||||
| ALEJANDRO INFANTE SARACHO | 2014 | $ | 410,208 | None | $ | 796,746 | $ | 180,417 | $ | 157,899 | $ | 50,734 | $ | 1,596,004 | |||||||||||||||
| Former Senior Vice President and | 2013 | $ | 399,425 | None | $ | 432,253 | $ | 176,496 | $ | 246,885 | $ | 52,602 | $ | 1,307,661 | |||||||||||||||
| President International | 2012 | $ | 391,291 | None | $ | 234,639 | $ | 309,097 | $ | 102,150 | $ | 49,729 | $ | 1,086,906 | |||||||||||||||
| SUSAN R. LICHTENSTEIN | 2014 | $ | 452,246 | None | $ | 789,227 | $ | 208,381 | $ | 208,617 | $ | 56,738 | $ | 1,715,209 | |||||||||||||||
| Senior Vice President, Corporate Affairs, | 2013 | $ | 443,693 | None | $ | 480,165 | $ | 196,057 | $ | 235,068 | $ | 53,649 | $ | 1,408,632 | |||||||||||||||
| Chief Legal Officer and Secretary | 2012 | $ | 433,953 | None | $ | 318,548 | $ | 419,650 | $ | 119,250 | $ | 52,704 | $ | 1,344,105 | |||||||||||||||
| ALTON E. SHADER (8) | 2014 | $ | 418,357 | None | $ | 1,068,911 | $ | 202,249 | $ | 204,006 | $ | 51,247 | $ | 1,944,770 | |||||||||||||||
| Senior Vice President and | |||||||||||||||||||||||||||||
| President North America | |||||||||||||||||||||||||||||
| 1) | In 2014 Mr. |
| 2) | The |
| 3) | The |
| 4) | The amounts in this column represent cash awards earned for the applicable fiscal year and paid in the subsequent fiscal year, under our |
Please refer to the “All Other Compensation” table below for further information: |
| All Other Compensation for Fiscal Year 2011 | |||||||||
| Company Contributions | |||||||||
| Name | 401(k) (a) | Supp 401(k) (a) | Cash Payout Unused Vacation | Relocation Reimbursements | Severance Benefits | Other Benefits (b) | Total All Other Compensation | ||
| Mr. Greisch | $17,150 | $157,852 | - | - | - | - | $175,002 | ||
| Mr. Guinan | $17,150 | $28,482 | - | $13,839 | - | - | $59,471 | ||
| Ms. Aronson | $19,423 | $31,166 | - | - | - | $2,802 | $53,391 | ||
| Mr. Infante Saracho | $23,877 | $24,992 | - | - | - | $1,811 | $50,680 | ||
| Ms. Lichtenstein | $23,950 | $30,028 | - | - | - | - | $53,978 | ||
| Mr. Miller | - | $6,913 | $23,077 | - | $460,000 | $7,692 | $497,682 | ||
| All Other Compensation for Fiscal Year 2014 | ||||
| Company Contributions | ||||
| Name | 401(k) (a) | Supp 401(k) (a) | Other Benefits | Total All Other Compensation |
| Mr. Greisch | $18,400 | $173,888 | $4,938 | $197,226 |
| Mr. Macek | $16,581 | $0 | $317 | $16,898 |
| Mr. Saccaro | $15,481 | $19,076 | $550 | $35,107 |
| Mr. Infante Saracho | $18,400 | $26,859 | $5,475 | $50,734 |
| Ms. Lichtenstein | $18,400 | $32,443 | $5,895 | $56,738 |
| Mr. Shader | $18,400 | $25,694 | $7,153 | $51,247 |
| a) | Amounts represent Company matching contributions to the Named Executive Officer’s accounts in the applicable plans: 401(k) Savings Plan and 401(k) Savings Plan portion of the |
| 7) |
| Prior to fiscal |
Grants of Plan-Based Awards forFor Fiscal Year Ended September 30, 20112014
The following table summarizes the grants of plan-based awards to each of the Named Executive Officers for the fiscal year ended September 30, 2011.2014. All stock-basedequity awards ingranted during fiscal year 20112014 were granted under our Stock Incentive Plan.
| All Other | |||||||||||||||||||||||||||||||||||||||||||||||||||||||
| Stock | |||||||||||||||||||||||||||||||||||||||||||||||||||||||
| Estimated Future Payouts Under Non-Equity | Estimated Future Payouts Under Equity | Awards: | Exercise | Grant Date | |||||||||||||||||||||||||||||||||||||||||||||||||||
| Incentive Plan Awards (1) | Incentive Plan Awards (2) | Number of | or Base | Fair Value | |||||||||||||||||||||||||||||||||||||||||||||||||||
| Actual | Shares or | Price of | of Stock | ||||||||||||||||||||||||||||||||||||||||||||||||||||
Estimated Future Payouts Under Non-Equity Incentive Plan Awards (1) | Estimated Future Payouts Under Equity Incentive Plan Awards (2) | All Other Stock Awards: Number of | All Other Option Awards: Number of | Exercise or Base Price of | Grant Date Fair Value of | Grant | Amount | Stock Units | Option | and Option | |||||||||||||||||||||||||||||||||||||||||||||
| Name | Grant Date | Min | Target | Max | Min | Target | Max | Shares of Stock or Units (3) | Securities Underlying Options (3) | Option Awards (4) | Stock and Option Awards (5) | Date | 2014 | Min. | Target | Max. | Min. | Target | Max. | (3) | Awards (4) | Awards (5) | |||||||||||||||||||||||||||||||||
| John J. Greisch | $- | $887,397 | $1,774,795 | $ | 774,895 | - | $ | 1,061,500 | $ | 2,388,375 | |||||||||||||||||||||||||||||||||||||||||||||
| 11/16/2010 | 147,679 | $38.81 | $1,800,207 | 11/18/2013 | 80,797 | $ | 41.53 | $ | 963,908 | ||||||||||||||||||||||||||||||||||||||||||||||
| 11/16/2010 | - | 11,597 | 46,386 | $1,448,171 | 11/18/2013 | 23,210 | $ | 963,911 | |||||||||||||||||||||||||||||||||||||||||||||||
| 12/12/2013 | 50,026 | $ | 2,000,040 | ||||||||||||||||||||||||||||||||||||||||||||||||||||
| Mark J. Guinan | $- | $270,000 | $540,000 | ||||||||||||||||||||||||||||||||||||||||||||||||||||
| 11/18/2013 | - | 46,420 | 104,445 | $ | 2,223,982 | ||||||||||||||||||||||||||||||||||||||||||||||||||
| Michael S. Macek | $ | 102,940 | - | $ | 94,009 | $ | 211,520 | ||||||||||||||||||||||||||||||||||||||||||||||||
| 12/13/2010 | 34,242 | $41.84 | $449,940 | 11/18/2013 | 3,468 | $ | 41.53 | $ | 41,373 | ||||||||||||||||||||||||||||||||||||||||||||||
| 12/13/2010 | 25,000 | (6) | $41.84 | $328,500 | 11/18/2013 | 3,405 | $ | 141,409 | |||||||||||||||||||||||||||||||||||||||||||||||
| 12/13/2010 | 30,221 | (6) | $1,250,012 | 11/18/2013 | - | 1,993 | 4,484 | $ | 95,485 | ||||||||||||||||||||||||||||||||||||||||||||||
| 12/13/2010 | - | 2,689 | 10,756 | $362,047 | |||||||||||||||||||||||||||||||||||||||||||||||||||
| James K. Saccaro (6) | - | - | - | - | |||||||||||||||||||||||||||||||||||||||||||||||||||
| 12/30/2013 | 19,393 | $ | 41.29 | $ | 230,001 | ||||||||||||||||||||||||||||||||||||||||||||||||||
| Martha G. Aronson | $- | $259,457 | $518,915 | ||||||||||||||||||||||||||||||||||||||||||||||||||||
| 11/16/2010 | 31,121 | $38.81 | $379,365 | 12/30/2013 | 35,846 | $ | 1,480,082 | ||||||||||||||||||||||||||||||||||||||||||||||||
| 11/16/2010 | - | 2,444 | 9,775 | $305,176 | 12/30/2013 | - | 11,141 | 25,067 | $ | 533,765 | |||||||||||||||||||||||||||||||||||||||||||||
| Alejandro Infante Saracho | $- | $228,353 | $456,707 | $ | 157,899 | - | $ | 288,400 | $ | 648,900 | |||||||||||||||||||||||||||||||||||||||||||||
| 11/16/2010 | 30,403 | $38.81 | $370,613 | 11/18/2013 | 15,123 | $ | 41.53 | $ | 180,417 | ||||||||||||||||||||||||||||||||||||||||||||||
| 11/16/2010 | - | 2,388 | 9,550 | $298,151 | 11/18/2013 | 9,161 | $ | 380,456 | |||||||||||||||||||||||||||||||||||||||||||||||
| 11/18/2013 | - | 8,689 | 19,550 | $ | 416,290 | ||||||||||||||||||||||||||||||||||||||||||||||||||
| Susan R. Lichtenstein | $- | $253,352 | $506,705 | $ | 208,617 | - | $ | 272,168 | $ | 612,378 | |||||||||||||||||||||||||||||||||||||||||||||
| 11/16/2010 | 30,388 | $38.81 | $370,430 | 11/18/2013 | 17,467 | $ | 41.53 | $ | 208,381 | ||||||||||||||||||||||||||||||||||||||||||||||
| 11/16/2010 | - | 2,386 | 9,545 | $297,995 | 11/18/2013 | 7,426 | $ | 308,402 | |||||||||||||||||||||||||||||||||||||||||||||||
| 11/18/2013 | - | 10,036 | 22,581 | $ | 480,825 | ||||||||||||||||||||||||||||||||||||||||||||||||||
| Gregory N. Miller | $- | $- | $- | - | - | - | - | $- | - | ||||||||||||||||||||||||||||||||||||||||||||||
| Alton E. Shader | $ | 204,006 | - | $ | 294,168 | $ | 661,878 | ||||||||||||||||||||||||||||||||||||||||||||||||
| 11/18/2013 | 16,953 | $ | 41.53 | $ | 202,249 | ||||||||||||||||||||||||||||||||||||||||||||||||||
| 11/18/2013 | 14,502 | $ | 602,268 | ||||||||||||||||||||||||||||||||||||||||||||||||||||
| 11/18/2013 | - | 9,740 | 21,915 | $ | 466,643 | ||||||||||||||||||||||||||||||||||||||||||||||||||
| 1) | Amounts represent actual and the potential cash awards that could |
| 2) | The amounts under the “Maximum” column reflect the number of PSUs granted to the Named Executive Officer on November |
| 3) | Amounts under this column represent stock options and RSU’s granted to our Named Executive Officers during fiscal year |
36
| 4) | The average of the high and low selling prices of our common stock on the New York Stock Exchange on the grant |
| 5) | The grant date fair values of stock |
| 6) |
Outstanding Equity Awards atAt September 30, 20102014
The following table summarizes the number and terms of stock options, deferred stock shares and PSUs outstanding for each of the Named Executive Officers as of September 30, 2011.2014.
| Option Awards | Stock Awards | Option Awards | Stock Awards | ||||||||||||||||||||||||||||||||||||||||||||||||||||||||
Name | Number of Securities Underlying Unexercised Options | Number of Securities Underlying Unexercised Options Unexercisable | Option Grant Date (1) | Option Exercise Price | Option Expiration Date | Number of Shares or Units of Stock That Have Not Vested (2) | Market Value of Shares or Units of Stock That Have Not Vested (3) | Equity Incentive Plan Awards: Number of Unearned Shares, Units or Other Rights That Have Not Vested(4) | Equity Incentive Plan Awards: Market or Payout Value of Unearned Shares, Units or Other Rights That Have Not Vested (3) | Number of Securities Underlying Unexercised Options | Number of Securities Underlying Unexercised Options Unexcercisable | Option Grant Date (1) | Option Exercise Price | Option Expiration Date | Grant Date | Number of Shares or Units of Stock That Have Not Vested (2) | Market Value of Shares or Units of Stock That Have Not Vested (3) | Equity Incentive Plan Awards: Number of Unearned Shares, Units or Other Rights That Have Not Vested (4) | Equity Incentive Plan Awards: Market or Payout Value of Unearned Shares, Units or Other Rights That Have Not Vested (3) | ||||||||||||||||||||||||||||||||||||||||
| John J. Greisch | 51,996 | 155,991 | 1/8/2010 | $ | 23.92 | 1/8/2020 | 34,171 | $ | 1,025,813 | 207,987 | 0 | 1/8/2010 | $ | 23.92 | 1/8/2020 | ||||||||||||||||||||||||||||||||||||||||||||
| 147,679 | 11/16/2010 | 38.81 | 11/16/2020 | 46,386 | $ | 1,392,508 | 110,759 | 36,920 | 11/16/2010 | $ | 38.81 | 11/16/2020 | |||||||||||||||||||||||||||||||||||||||||||||||
| 94,581 | 94,581 | 11/29/2011 | $ | 30.63 | 11/29/2021 | 11/29/2011 | 34,428 | $ | 1,426,352 | ||||||||||||||||||||||||||||||||||||||||||||||||||
| Mark J. Guinan | 34,242 | 12/13/2010 | 41.84 | 12/13/2020 | 30,221 | $ | 907,234 | 10,756 | $ | 322,895 | |||||||||||||||||||||||||||||||||||||||||||||||||
| 25,000 | 12/13/2010 | 41.84 | 12/13/2020 | 30,095 | 90,288 | 11/13/2012 | $ | 26.94 | 11/13/2022 | 11/13/2012 | 36,163 | $ | 1,498,250 | 70,156 | $ | 2,906,563 | |||||||||||||||||||||||||||||||||||||||||||
| 0 | 80,797 | 11/18/2013 | $ | 41.53 | 11/18/2023 | 11/18/2013 | 23,552 | $ | 975,744 | 46,420 | $ | 1,923,181 | |||||||||||||||||||||||||||||||||||||||||||||||
| Martha G. Aronson | 2,500 | 7,500 | 8/2/2010 | 34.28 | 8/2/2020 | 12,577 | $ | 377,562 | |||||||||||||||||||||||||||||||||||||||||||||||||||
| 31,121 | 11/16/2010 | 38.81 | 11/16/2020 | 9,775 | $ | 293,446 | 12/12/2013 | 50,762 | $ | 2,103,083 | �� | ||||||||||||||||||||||||||||||||||||||||||||||||
| Michael S. Macek | 2,250 | 0 | 5/27/2008 | $ | 31.35 | 5/27/2018 | |||||||||||||||||||||||||||||||||||||||||||||||||||||
| 2,154 | 718 | 11/16/2010 | $ | 38.81 | 11/16/2020 | ||||||||||||||||||||||||||||||||||||||||||||||||||||||
| 1,534 | 3,068 | 11/29/2011 | $ | 30.63 | 11/29/2021 | 11/29/2011 | 1,117 | $ | 46,277 | ||||||||||||||||||||||||||||||||||||||||||||||||||
| 0 | 3,086 | 11/13/2012 | $ | 26.94 | 11/13/2022 | 11/13/2012 | 1,236 | $ | 51,212 | 2,397 | $ | 99,308 | |||||||||||||||||||||||||||||||||||||||||||||||
| 0 | 3,468 | 11/18/2013 | $ | 41.53 | 11/18/2023 | 11/18/2013 | 3,455 | $ | 143,146 | 1,993 | $ | 82,570 | |||||||||||||||||||||||||||||||||||||||||||||||
| James K. Saccaro (5) | |||||||||||||||||||||||||||||||||||||||||||||||||||||||||||
| Alejandro Infante Saracho | 3,434 | 10,303 | 5/6/2010 | 31.69 | 5/6/2020 | 5,622 | $ | 168,772 | 13,737 | 0 | 5/6/2010 | $ | 31.69 | 5/6/2020 | |||||||||||||||||||||||||||||||||||||||||||||
| 22,802 | 7,601 | 11/16/2010 | $ | 38.81 | 11/16/2020 | ||||||||||||||||||||||||||||||||||||||||||||||||||||||
| 15,802 | 15,803 | 11/29/2011 | $ | 30.63 | 11/29/2021 | 11/29/2011 | 5,753 | $ | 238,347 | ||||||||||||||||||||||||||||||||||||||||||||||||||
| 5,578 | 16,735 | 11/13/2012 | $ | 26.94 | 11/13/2022 | 11/13/2012 | 6,703 | $ | 277,713 | 13,004 | $ | 538,756 | |||||||||||||||||||||||||||||||||||||||||||||||
| 30,403 | 11/16/2010 | 38.81 | 11/16/2020 | 9,550 | $ | 286,691 | 0 | 15,123 | 11/18/2013 | $ | 41.53 | 11/18/2023 | 11/18/2013 | 9,296 | $ | 385,127 | 8,689 | $ | 359,985 | ||||||||||||||||||||||||||||||||||||||||
| Susan R. Lichtenstein | 4,906 | 14,719 | 5/6/2010 | 31.69 | 5/6/2020 | 8,030 | $ | 241,061 | 19,625 | 0 | 5/6/2010 | $ | 31.69 | 5/6/2020 | |||||||||||||||||||||||||||||||||||||||||||||
| 30,388 | 11/16/2010 | 38.81 | 11/16/2020 | 9,545 | $ | 286,541 | 22,791 | 7,597 | 11/16/2010 | $ | 38.81 | 11/16/2020 | |||||||||||||||||||||||||||||||||||||||||||||||
| 21,454 | 21,455 | 11/29/2011 | $ | 30.63 | 11/29/2021 | 11/29/2011 | 7,810 | $ | 323,568 | ||||||||||||||||||||||||||||||||||||||||||||||||||
| Gregory N. Miller (5) | |||||||||||||||||||||||||||||||||||||||||||||||||||||||||||
| 6,196 | 18,590 | 11/13/2012 | $ | 26.94 | 11/13/2022 | 11/13/2012 | 7,447 | $ | 308,508 | 14,445 | $ | 598,456 | |||||||||||||||||||||||||||||||||||||||||||||||
| 0 | 17,467 | 11/18/2013 | $ | 41.53 | 11/18/2023 | 11/18/2013 | 7,535 | $ | 312,188 | 10,036 | $ | 415,791 | |||||||||||||||||||||||||||||||||||||||||||||||
| Alton E. Shader | 2,991 | 997 | 7/11/2011 | $ | 45.91 | 7/11/2021 | |||||||||||||||||||||||||||||||||||||||||||||||||||||
| 10,169 | 10,169 | 11/29/2011 | $ | 30.63 | 11/29/2021 | 11/29/2011 | 3,702 | $ | 153,374 | ||||||||||||||||||||||||||||||||||||||||||||||||||
| 5,684 | 17,055 | 11/13/2012 | $ | 26.94 | 11/13/2022 | 11/13/2012 | 6,831 | $ | 283,009 | 13,252 | $ | 549,030 | |||||||||||||||||||||||||||||||||||||||||||||||
| 0 | 16,953 | 11/18/2013 | $ | 41.53 | 11/18/2023 | 11/18/2013 | 14,715 | $ | 609,661 | 9,740 | $ | 403,528 | |||||||||||||||||||||||||||||||||||||||||||||||
| 1) | Unvested stock options based solely on continued employment will become exercisable in |
| 2) | Unvested RSUs based solely on continued employment will vest in accordance with the following vesting schedules. The amounts include reinvested dividends. |
Grant Date | Remaining Vesting Schedules (as of 9/30/ | |
| 12/ | ||
| 25,381 shares fully vest on 12/13/2016 | ||
| 11/18/2013 | Fully vest on | |
| Fully vest on | ||
38
| 3) | Market value is determined by multiplying the number of unvested RSUs and/or PSUs by |
| 4) | Represents PSUs granted on November |
| 5) | As a result of Mr. |
Option Exercises and Stock Vested For Fiscal Year Ended September 30, 20112014
The following table summarizes the number of stock option awards exercised and the value realized upon exercise during the fiscal year ended September 30, 20112014 for the Named Executive Officers, as well as the number of stock awards vested and the value realized upon vesting.
| Option Awards | Stock Awards | Option Awards | Stock Awards | |||||
| Name | Number of Shares Acquired on Exercise | Value Realized on Exercise | Number of Shares Acquired on Vesting (1) | Value Realized on Vesting | Number of Shares Acquired on Exercise | Value Realized on Exercise | Number of Shares Acquired on Vesting (1) | Value Realized on Vesting |
| John J. Greisch | - | - | - | - | 64,073 | $2,438,636 | ||
| Mark J. Guinan | - | - | - | |||||
| Michael S. Macek | 1,802 | $22,324 | 3,336 | $126,300 | ||||
| Martha G. Aronson | - | - | - | |||||
| James K. Saccaro | - | - | ||||||
| Alejandro Infante Saracho | - | - | - | - | 9,550 | $344,469 | ||
| Susan R. Lichtenstein | - | - | - | - | 9,545 | $344,288 | ||
| Gregory N. Miller | 152,686 | $1,949,627 | 23,750 | $982,324 | ||||
| Alton E. Shader | - | 8,582 | $344,810 | |||||
| 1) | The pre-tax amounts indicated include a portion of dividends accrued and paid on the date the stock awards vested. |
| Name | Plan Name (1) | Number of Years Credited Service | Present Value of Accumulated Benefit (2) | Payments During Last Fiscal Year |
| John J. Greisch | - | - | - | - |
| Mark J. Guinan | - | - | - | - |
| Martha G. Aronson | - | - | - | - |
| Alejandro Infante Saracho | - | - | - | - |
| Susan R. Lichtenstein | - | - | - | - |
| Gregory N. Miller | Master Pension Plan | 2 | $31,160 | - |
Nonqualified Deferred Compensation for Fiscal Year Ending September 30, 20112014
| Name | Plan (2) | Executive Contributions in Last FY | Registrant Contributions in Last FY | Aggregate Earnings in Last FY (3) | Aggregate Withdrawals/ Distributions | Aggregate Balance at Last FYE (4) |
| John J. Greisch | SERP | - | $173,888 | $66,126 | None | $921,118 |
| Michael S. Macek | SERP | - | - | - | None | - |
| James K. Saccaro (1) | SERP | - | $19,076 | $117 | None | $10,967 |
| Alejandro Infante Saracho | SERP | - | $27,706 | $9,793 | None | $127,609 |
| Susan R. Lichtenstein | SERP | - | $32,443 | $10,281 | None | $147,433 |
| Alton E. Shader | SERP | - | $25,694 | $6,359 | None | $82,265 |
| Name | Plan (1) | Executive Contributions in Last FY | Registrant Contributions in Last FY | Aggregate Earnings in Last FY (2) | Aggregate Withdrawals/ Distributions | Aggregate Balance at Last FYE (3) |
| John J. Greisch | SERP | $- | $157,852 | $(17,692) | None | $244,981 |
| Mark J. Guinan | SERP | $- | $28,482 | $(1,992) | None | $26,490 |
| Martha G. Aronson | SERP | $- | $31,166 | $(2,493) | None | $28,673 |
| Alejandro Infante | SERP | $- | $30,028 | $(1,907) | None | $28,121 |
| Susan R. Lichtenstein | SERP | $- | $24,992 | $(1,882) | None | $23,110 |
| Gregory N. Miller | SERP | $- | $6,913 | $4,073 | $(170,969) |
| 1) | Prior to Mr. Saccaro’s resignation, $10,967 of the Company contributions vested. | |
| 2) | We maintain a 401(k) Savings Plan portion of the SERP to provide additional retirement benefits to certain employees whose retirement benefits under the 401(k) Savings Plan are limited under the Internal Revenue Code of 1986. The additional retirement benefits provided by the SERP are for certain participants chosen by the Compensation Committee, and they may annually receive an additional benefit of a certain percentage of their Compensation for such year. “Compensation” under the SERP means the corresponding definition of compensation under the 401(k) Savings Plan plus a percentage of a participant's eligible compensation as determined under our STIC Program. A lump sum cash payment is available to the participant beginning on the six-month anniversary of the date of the Named Executive Officer’s termination of employment (except for termination for cause, where the entire SERP is forfeited). |
| Plan (1) | Aggregate Summary Compensation Table | |
| John J. Greisch | SERP | $601,661 |
| SERP | $ | |
| Alejandro Infante Saracho | SERP | $ |
| Susan R. Lichtenstein | SERP | $ |
| SERP | $ |
Potential Payments Upon Termination or Change in Control
Benefits Payable Upon Termination Under Employment Agreements
Based upon a hypothetical termination date of September 30, 2011,2014, the benefits would be as follows (except in certain situations, identified below, where a Separation Agreement has been executed between the Company and the executive):follows:
John J. Greisch | ||||||||||||||||||||||||||||||||||||||||||||||||
| Accelerated | Accelerated | Continuance of | Limited | Accelerated | Accelerated | Continuance of | Limited | |||||||||||||||||||||||||||||||||||||||||
| Salary & Other | Vesting of | Vesting of | Health & | Outplacement | Salary & Other | Vesting of | Vesting of | Health & | Outplacement | |||||||||||||||||||||||||||||||||||||||
| Event | Cash Payments | Stock Options (2) | Stock Awards (3) | Welfare Benefits (4) | Assistance | Total | Cash Payments | Stock Options (2) | Stock Awards (3) | Welfare Benefits (4) | Assistance | Total | ||||||||||||||||||||||||||||||||||||
| Permanent Disability (1) | $1,847,009 | $951,545 | $2,418,296 | $15,579 | $5,232,429 | $ | 1,507,979 | $ | 2,426,478 | $ | 10,833,172 | $ | 16,211 | $ | 14,783,840 | |||||||||||||||||||||||||||||||||
| Death | $534,615 | $951,545 | $2,418,296 | $12,999 | $3,917,455 | $ | 537,115 | $ | 2,426,478 | $ | 10,833,172 | $ | 13,631 | $ | 13,810,396 | |||||||||||||||||||||||||||||||||
| Termination Without Cause | $1,834,615 | $15,579 | $10,000 | $1,860,194 | $ | 1,967,115 | $ | 16,211 | $ | 10,000 | $ | 1,993,326 | ||||||||||||||||||||||||||||||||||||
| Resignation With Good Reason | $1,834,615 | $15,579 | $10,000 | $1,860,194 | $ | 1,967,115 | $ | 16,211 | $ | 10,000 | $ | 1,993,326 | ||||||||||||||||||||||||||||||||||||
| Termination for Cause | $34,615 | $34,615 | $ | 37,115 | $ | 37,115 | ||||||||||||||||||||||||||||||||||||||||||
| Resignation Without Good Reason | $34,615 | $34,615 | $ | 37,115 | $ | 37,115 | ||||||||||||||||||||||||||||||||||||||||||
| Retirement (5) | $34,615 | $34,615 | ||||||||||||||||||||||||||||||||||||||||||||||
| Retirement | $ | 37,115 | $ | 37,115 | ||||||||||||||||||||||||||||||||||||||||||||
| Mark J. Guinan | ||||||||||||||||||||||||||||||||||||||||||||||||
| Michael S. Macek | ||||||||||||||||||||||||||||||||||||||||||||||||
| Accelerated | Accelerated | Continuance of | Limited | Accelerated | Accelerated | Continuance of | Limited | |||||||||||||||||||||||||||||||||||||||||
| Salary & Other | Vesting of | Vesting of | Health & | Outplacement | Salary & Other | Vesting of | Vesting of | Health & | Outplacement | |||||||||||||||||||||||||||||||||||||||
| Event | Cash Payments | Stock Options (2) | Stock Awards (3) | Welfare Benefits (4) | Assistance | Total | Cash Payments | Stock Options (2) | Stock Awards (3) | Welfare Benefits (4) | Assistance | Total | ||||||||||||||||||||||||||||||||||||
| Permanent Disability (1) | $2,362,466 | $0 | $1,230,125 | $13,899 | $3,606,490 | $ | 2,298,735 | $ | 79,732 | $ | 422,512 | $ | 4,396 | $ | 2,805,375 | |||||||||||||||||||||||||||||||||
| Death | $534,615 | $0 | $1,230,125 | $12,999 | $1,777,739 | $ | 504,135 | $ | 79,732 | $ | 422,512 | $ | 0 | $ | 1,006,379 | |||||||||||||||||||||||||||||||||
| Termination Without Cause | $484,615 | $13,899 | $10,000 | $508,514 | $ | 136,635 | $ | 4,396 | $ | 10,000 | $ | 151,031 | ||||||||||||||||||||||||||||||||||||
| Resignation With Good Reason | $484,615 | $13,899 | $10,000 | $508,514 | $ | 136,635 | $ | 4,396 | $ | 10,000 | $ | 151,031 | ||||||||||||||||||||||||||||||||||||
| Termination for Cause | $34,615 | $34,615 | $ | 14,135 | $ | 14,135 | ||||||||||||||||||||||||||||||||||||||||||
| Resignation Without Good Reason | $34,615 | $34,615 | $ | 14,135 | $ | 14,135 | ||||||||||||||||||||||||||||||||||||||||||
| Retirement (5) | $34,615 | $34,615 | ||||||||||||||||||||||||||||||||||||||||||||||
| Retirement | $ | 14,135 | $ | 14,135 | ||||||||||||||||||||||||||||||||||||||||||||
| Martha G. Aronson | ||||||||||||||||||||||||||||||||||||||||||||||||
| James K. Saccaro (5) | ||||||||||||||||||||||||||||||||||||||||||||||||
| Alejandro Infante Saracho | ||||||||||||||||||||||||||||||||||||||||||||||||
| Accelerated | Accelerated | Continuance of | Limited | Accelerated | Accelerated | Continuance of | Limited | |||||||||||||||||||||||||||||||||||||||||
| Salary & Other | Vesting of | Vesting of | Health & | Outplacement | Salary & Other | Vesting of | Vesting of | Health & | Outplacement | |||||||||||||||||||||||||||||||||||||||
| Event | Cash Payments | Stock Options (2) | Stock Awards (3) | Welfare Benefits (4) | Assistance | Total | Cash Payments | Stock Options (2) | Stock Awards (3) | Welfare Benefits (4) | Assistance | Total | ||||||||||||||||||||||||||||||||||||
| Permanent Disability (1) | $2,766,686 | $0 | $671,005 | $13,599 | $3,451,290 | $ | 1,969,755 | $ | 433,077 | $ | 1,799,928 | $ | 14,155 | $ | 4,216,915 | |||||||||||||||||||||||||||||||||
| Death | $533,346 | $0 | $671,005 | $12,999 | $1,217,350 | $ | 523,769 | $ | 433,077 | $ | 1,799,928 | $ | 12,775 | $ | 2,769,549 | |||||||||||||||||||||||||||||||||
| Termination Without Cause | $466,846 | $13,599 | $10,000 | $490,445 | $ | 435,769 | $ | 14,155 | $ | 10,000 | $ | 459,924 | ||||||||||||||||||||||||||||||||||||
| Resignation With Good Reason | $466,846 | $13,599 | $10,000 | $490,445 | $ | 435,769 | $ | 14,155 | $ | 10,000 | $ | 459,924 | ||||||||||||||||||||||||||||||||||||
| Termination for Cause | $33,346 | $33,346 | $ | 23,769 | $ | 23,769 | ||||||||||||||||||||||||||||||||||||||||||
| Resignation Without Good Reason | $33,346 | $33,346 | $ | 23,769 | $ | 23,769 | ||||||||||||||||||||||||||||||||||||||||||
| Retirement (5) | $33,346 | $33,346 | ||||||||||||||||||||||||||||||||||||||||||||||
| Retirement | $ | 23,769 | $ | 23,769 | ||||||||||||||||||||||||||||||||||||||||||||
| Alejandro Infante Saracho | ||||||||||||||||||||||||||||||||||||||||||||||||
| Accelerated | Accelerated | Continuance | Limited | |||||||||||||||||||||||||||||||||||||||||||||
| Salary & Other | Vesting of | Vesting of | Health & | Outplacement | ||||||||||||||||||||||||||||||||||||||||||||
| Event | Cash Payments | Stock Options (2) | Stock Awards (3) | Welfare Benefits (4) | Assistance | Total | ||||||||||||||||||||||||||||||||||||||||||
| Permanent Disability (1) | $2,225,829 | $- | $455,451 | $14,379 | $2,695,659 | |||||||||||||||||||||||||||||||||||||||||||
| Death | $522,212 | $- | $455,451 | $12,999 | $990,662 | |||||||||||||||||||||||||||||||||||||||||||
| Termination Without Cause | $407,212 | $14,379 | $10,000 | $431,591 | ||||||||||||||||||||||||||||||||||||||||||||
| Resignation With Good Reason | $407,212 | $14,379 | $10,000 | $431,591 | ||||||||||||||||||||||||||||||||||||||||||||
| Termination for Cause | $22,212 | $22,212 | ||||||||||||||||||||||||||||||||||||||||||||||
| Resignation Without Good Reason | $22,212 | $22,212 | ||||||||||||||||||||||||||||||||||||||||||||||
| Retirement (5) | $22,212 | $22,212 | ||||||||||||||||||||||||||||||||||||||||||||||
| Susan R. Lichtenstein | ||||||||||||||||||||||||||||||||||||||||||||||||
| Accelerated | Accelerated | Continuance | Limited | Accelerated | Accelerated | Continuance of | Limited | |||||||||||||||||||||||||||||||||||||||||
| Salary & Other | Vesting of | Vesting of | Health & | Outplacement | Salary & Other | Vesting of | Vesting of | Health & | Outplacement | |||||||||||||||||||||||||||||||||||||||
| Event | Cash Payments | Stock Options (2) | Stock Awards (3) | Welfare Benefits (4) | Assistance | Total | Cash Payments | Stock Options (2) | Stock Awards (3) | Welfare Benefits (4) | Assistance | Total | ||||||||||||||||||||||||||||||||||||
| Permanent Disability (1) | $1,812,173 | $- | $527,595 | $14,379 | $2,354,147 | $ | 1,488,429 | $ | 520,987 | $ | 1,958,512 | $ | 15,373 | $ | 3,983,301 | |||||||||||||||||||||||||||||||||
| Death | $524,421 | $- | $527,595 | $12,999 | $1,065,015 | $ | 526,170 | $ | 520,987 | $ | 1,958,512 | $ | 12,793 | $ | 3,018,462 | |||||||||||||||||||||||||||||||||
| Termination Without Cause | $447,721 | $14,379 | $10,000 | $472,100 | $ | 479,784 | $ | 15,373 | $ | 10,000 | $ | 505,157 | ||||||||||||||||||||||||||||||||||||
| Resignation With Good Reason | $447,721 | $14,379 | $10,000 | $472,100 | $ | 479,784 | $ | 15,373 | $ | 10,000 | $ | 505,157 | ||||||||||||||||||||||||||||||||||||
| Termination for Cause | $24,421 | $24,421 | $ | 26,170 | $ | 26,170 | ||||||||||||||||||||||||||||||||||||||||||
| Resignation Without Good Reason | $24,421 | $24,421 | $ | 26,170 | $ | 26,170 | ||||||||||||||||||||||||||||||||||||||||||
| Retirement (5) | $24,421 | $24,421 | ||||||||||||||||||||||||||||||||||||||||||||||
| Retirement | $ | 26,170 | $ | 26,170 | ||||||||||||||||||||||||||||||||||||||||||||
| Alton E. Shader | ||||||||||||||||||||||||||||||||||||||||||||||||
| Accelerated | Accelerated | Continuance of | Limited | |||||||||||||||||||||||||||||||||||||||||||||
| Salary & Other | Vesting of | Vesting of | Health & | Outplacement | ||||||||||||||||||||||||||||||||||||||||||||
| Event | Cash Payments | Stock Options (2) | Stock Awards (3) | Welfare Benefits (4) | Assistance | Total | ||||||||||||||||||||||||||||||||||||||||||
| Permanent Disability (1) | $ | 2,948,503 | $ | 356,952 | $ | 1,998,603 | $ | 13,375 | $ | 5,317,433 | ||||||||||||||||||||||||||||||||||||||
| Death | $ | 516,163 | $ | 356,952 | $ | 1,998,603 | $ | 12,775 | $ | 2,884,493 | ||||||||||||||||||||||||||||||||||||||
| Termination Without Cause | $ | 436,403 | $ | 13,375 | $ | 10,000 | $ | 459,778 | ||||||||||||||||||||||||||||||||||||||||
| Resignation With Good Reason | $ | 436,403 | $ | 13,375 | $ | 10,000 | $ | 459,778 | ||||||||||||||||||||||||||||||||||||||||
| Termination for Cause | $ | 16,163 | $ | 16,163 | ||||||||||||||||||||||||||||||||||||||||||||
| Resignation Without Good Reason | $ | 16,163 | $ | 16,163 | ||||||||||||||||||||||||||||||||||||||||||||
| Retirement | $ | 16,163 | $ | 16,163 | ||||||||||||||||||||||||||||||||||||||||||||
| Benefits provided under our disability plans are based on various circumstances including the Named Executive Officer meeting certain eligibility requirements. Our disability plans are fully insured; therefore, claim payments are reviewed and processed by our third party insurance carrier. The following assumptions were used to determine the salary and other cash payment amount for permanent disability: normal retirement age is based on the Social Security Normal Retirement Age Table, short-term disability benefits are based on salary continuation for 26 weeks; long-term disability benefits are based on the lesser of 60% of the Named Executive Officer's monthly earnings or $15,000 per month; and a |
| The amounts indicated represent the intrinsic value of all unvested non-qualified stock options that would have become immediately vested and exercisable upon permanent disability or death. |
| The amounts indicated represent the market value of all unvested RSUs and PSUs that would have vested immediately and been distributed upon permanent disability or death. The amounts were calculated based on the closing stock price of $41.43 on September 30, |
| Amounts represent the dollar value of the incremental cost to Hill-Rom by providing continuing health and life insurance coverage based on the individual’s selected coverage in effect immediately before the hypothetical termination. |
| 5) |
Benefits Payable Under Change in Control Agreements
Based upon a hypothetical Change in Control date of September 30, 2011,2014, the Change in Control benefitsBenefits with a termination of employment would be as follows:
Acceleration of Stock Based Awards | ||||||||||||||||||||||||||||||||||||||||
| Name | Salary | Incentive Comp | Continuation of Health and Welfare Benefits | Vacation Benefits | Retirement Savings Plan Benefits | Limited Outplacement Assistance | Continuation of Term Life Insurance Coverage | Stock Options (1) | RSUs (2) | Total | ||||||||||||||||||||||||||||||
| John J. Greisch | ||||||||||||||||||||||||||||||||||||||||
| With termination | $ | 2,700,000 | $ | 1,197,986 | $ | 38,997 | $ | 34,615 | $ | 244,981 | $ | 10,000 | $ | 7,740 | $ | 1,268,721 | $ | 1,025,789 | $ | 6,528,829 | ||||||||||||||||||||
| Without termination | - | - | - | - | - | - | - | $ | 951,545 | $ | 1,025,789 | $ | 1,977,334 | |||||||||||||||||||||||||||
| Mark J. Guinan | ||||||||||||||||||||||||||||||||||||||||
| With termination | $ | 900,000 | $ | 364,500 | $ | 25,998 | $ | 34,615 | $ | 26,490 | $ | 10,000 | $ | 1,800 | - | - | $ | 1,363,403 | ||||||||||||||||||||||
| Without termination | - | - | - | - | - | - | - | - | - | - | ||||||||||||||||||||||||||||||
Martha G. Aronson | ||||||||||||||||||||||||||||||||||||||||
| With termination | $ | 867,000 | $ | 350,267 | $ | 25,998 | $ | 33,346 | $ | 28,673 | $ | 10,000 | $ | 1,200 | - | $ | 377,559 | $ | 1,694,043 | |||||||||||||||||||||
| Without termination | - | - | - | - | - | - | - | - | $ | 377,559 | $ | 377,559 | ||||||||||||||||||||||||||||
Susan R. Lichtenstein | ||||||||||||||||||||||||||||||||||||||||
| With termination | $ | 846,600 | $ | 342,026 | $ | 25,998 | $ | 24,421 | $ | 23,110 | $ | 10,000 | $ | 2,760 | - | $ | 241,055 | $ | 1,515,970 | |||||||||||||||||||||
| Without termination | - | - | - | - | - | - | - | - | $ | 241,055 | $ | 241,055 | ||||||||||||||||||||||||||||
Alejandro Infante Saracho | ||||||||||||||||||||||||||||||||||||||||
| With termination | $ | 770,000 | $ | 314,198 | $ | 25,998 | $ | 22,212 | $ | 28,121 | $ | 10,000 | $ | 2,760 | - | $ | 168,760 | $ | 1,342,049 | |||||||||||||||||||||
| Without termination | - | - | - | - | - | - | - | - | $ | 168,760 | $ | 168,760 | ||||||||||||||||||||||||||||
Gregory N. Miller (3) | ||||||||||||||||||||||||||||||||||||||||
| Acceleration of Stock Based Awards | ||||||||||||||||||||||||||||||||||||||||||||
| Name | Salary | Incentive Comp. | Continuation Of Health and Welfare Benefits | Vacation Benefits | Retirement Savings Plan Benefits | Limited Outplacement Assistance | Continuation of Term Life Insurance Coverage | Stock Options (1) | RSUs (2) | Performance Based Awards (3) | Total | |||||||||||||||||||||||||||||||||
| John J. Greisch | ||||||||||||||||||||||||||||||||||||||||||||
| With termination | $ | 1,451,335 | $ | 482,916 | $ | 10,381 | $ | 37,115 | $ | 1,182,641 | $ | 5,013 | $ | 3,929 | $ | 2,399,339 | $ | 4,505,577 | $ | 3,129,627 | $ | 13,207,873 | ||||||||||||||||||||||
| Without termination | $ | 2,426,478 | $ | 4,577,076 | $ | 0 | $ | 7,003,554 | ||||||||||||||||||||||||||||||||||||
| Michael S. Macek (4) | ||||||||||||||||||||||||||||||||||||||||||||
| With termination | $ | 122,500 | $ | 0 | $ | 1,904 | $ | 14,135 | $ | 0 | $ | 0 | $ | 588 | $ | 79,732 | $ | 194,357 | $ | 228,155 | $ | 641,371 | ||||||||||||||||||||||
| Without termination | $ | 79,732 | $ | 194,357 | $ | 0 | $ | 274,089 | ||||||||||||||||||||||||||||||||||||
| James Saccaro (5) | ||||||||||||||||||||||||||||||||||||||||||||
| Alejandro Infante Saracho | ||||||||||||||||||||||||||||||||||||||||||||
| With termination | $ | 602,325 | $ | 210,814 | $ | 18,735 | $ | 23,769 | $ | 127,608 | $ | 7,310 | $ | 2,024 | $ | 423,333 | $ | 637,651 | $ | 830,527 | $ | 2,884,096 | ||||||||||||||||||||||
| Without termination | $ | 433,077 | $ | 662,840 | $ | 0 | $ | 1,095,917 | ||||||||||||||||||||||||||||||||||||
| Susan R. Lichtenstein | ||||||||||||||||||||||||||||||||||||||||||||
| With termination | $ | 716,779 | $ | 215,033 | $ | 20,261 | $ | 26,170 | $ | 147,434 | $ | 7,901 | $ | 4,086 | $ | 515,965 | $ | 611,214 | $ | 1,056,372 | $ | 3,321,215 | ||||||||||||||||||||||
| Without termination | $ | 520,987 | $ | 620,696 | $ | 0 | $ | 1,141,683 | ||||||||||||||||||||||||||||||||||||
| Alton Shader | ||||||||||||||||||||||||||||||||||||||||||||
| With termination | $ | 489,827 | $ | 171,440 | $ | 14,981 | $ | 16,163 | $ | 82,265 | $ | 5,828 | $ | 704 | $ | 339,678 | $ | 810,658 | $ | 643,539 | $ | 2,575,083 | ||||||||||||||||||||||
| Without termination | $ | 356,952 | $ | 892,670 | $ | 0 | $ | 1,249,622 | ||||||||||||||||||||||||||||||||||||
| 1) | The amounts indicated represent the intrinsic value of all unvested non-qualified stock options that would |
| 2) | The amounts indicated represent the intrinsic value of all unvested RSUs that would |
| The amounts indicated represent the intrinsic value of all unvested PSUs that would become immediately vested and exercisable upon a change in control. The amounts were calculated based on the closing stock price of $41.43 on September 30, 2014 and adjusted, as |
| 4) | Mr. Macek does not have a change in control agreement with the Company. The benefits available to Mr. Macek following a change of control are subject to terms of his employment and stock award agreements. |
| 5) | Mr. Saccaro resigned from the Company on July 1, 2014 and was not entitled to any payments under a change in control agreement as of September 30, 2014. |
| DIRECTOR COMPENSATION |
In setting non-employee director compensation, the Board of Directors considers the significant amount of time that directors expend in fulfilling their duties to Hill-Rom as well as the skill-levelskill level required for members of the Board. Our director pay package is designed to attract and retain highly-qualified, independent professionals to monitor the effectiveness of policy and decision-making both at the Board and management level, with a view to enhancing shareholder value over the long term. Our Nominating/Corporate Governance Committee generally reviews our non-employee director compensation program or elements thereof, on an annual basis, with the assistance of the compensation consulting firm used by the Compensation Committee. Directors who are also employees of Hill-Rom receive no additional remuneration for services as a director.
For the first two quarters of fiscal year 2014 our non-employee directors (other than the Chair of the Board) receive an annualreceived a quarterly cash retainer of $50,000;$12,500; the Chair of the Board’s quarterly retainer was $25,000. Committee members, other than the Chair of the Board, of Directors’ annual retainer is $125,000. Committee members receivereceived a fee in the amount of $1,500 for each committee meeting attended, in person or by telephone, and thetelephone. Chairs of the Audit, Compensation and Nominating/Corporate Governance Committees receivereceived an additional $12,500, $8,000,$3,125, $2,500 and $7,000 annual$2,500 quarterly retainer, respectively. For the remainder of the fiscal year ended September 30, 2014, our non-employee directors (other than the Chair of the Board) received a quarterly cash retainer of $13,750; the Chair of the Board’s quarterly retainer was $27,500. Committee members of the Audit, Compensation and Nominating/Corporate Governance Committees received a quarterly retainer in the amount of $3,125, $1,875 and $1,250, respectively. Chairs of the Audit, Compensation and Nominating/Corporate Governance Committees received a quarterly retainer in the amount of $6,250, $5,000 and $3,750, respectively. Committee members received a fee in the amount of $1,500 for each other committee meeting attended, in person or by telephone. In addition, each non-employee director is, on the first trading day following the close of each annual meeting of the Company’s shareholders, awarded vested deferred RSUs valued at $120,000$150,000 ($200,000190,000 in the case of the Chair of the Board). A new director may receive a pro-rata portion of the annual award representing the time served during the fiscal year of joining the Board of Directors. Delivery of shares of common stock underlying these RSUs occurs on the later of one year and one day from the date of the grant or the six month anniversary of the date that the applicable director ceases to be a member of the Board of Directors. This compensation plan will remain in placeIn fiscal year 2014 the annual grant consisted of 4,980 vested deferred RSUs for the Chair of the Board and 3,931 for each other non-employee director. A new director may receive a pro-rata portion of the annual award representing time served during the fiscal year of joining the Board of Directors. Director Compensation for fiscal year 2012.2015 is unchanged from the second half of fiscal 2014.
Director Compensation Table For Fiscal Year Ending September 30, 20112014
| Change in Pension | ||||||||||||||||||||||||||||
| Value and Nonqualified | ||||||||||||||||||||||||||||
| Non-Equity | Deferred | |||||||||||||||||||||||||||
| Fees Earned or | Incentive Plan | Compensation | All Other | |||||||||||||||||||||||||
| Name | Paid in Cash | Stock Awards | Option Awards | Compensation | Earnings | Compensation | Total | |||||||||||||||||||||
| (1) | (2) | (3) | (4) | (5) | ||||||||||||||||||||||||
| Rolf A. Classon | $137,000 | $200,039 | - | - | - | $216 | $ | 337,255 | ||||||||||||||||||||
| James R. Giertz | $63,500 | $120,008 | - | - | - | $216 | $ | 183,724 | ||||||||||||||||||||
| Charles E. Golden | $82,000 | $120,008 | - | - | - | $216 | $ | 202,224 | ||||||||||||||||||||
| W August Hillenbrand | $50,000 | $120,008 | - | - | - | $140 | $ | 170,148 | ||||||||||||||||||||
| Ronald A. Malone | $64,000 | $120,008 | - | - | - | $216 | $ | 184,224 | ||||||||||||||||||||
| Eduardo R. Menascé | $65,000 | $120,008 | - | - | - | $216 | $ | 185,224 | ||||||||||||||||||||
| Katherine S. Napier | $63,500 | $120,008 | - | - | - | $216 | $ | 183,724 | ||||||||||||||||||||
| Joanne C. Smith, M.D. | $69,000 | $120,008 | - | - | - | $216 | $ | 189,224 | ||||||||||||||||||||
| Name | Fees Earned or Paid in Cash (1) | Stock Awards (2) | Option Awards | All Other Compensation (3) | Total |
| Rolf A. Classon | $123,250 | $190,037 | - | $216 | $313,503 |
| William G. Dempsey (4) | $43,750 | $150,007 | $126 | $193,883 | |
| James R. Giertz | $64,750 | $150,007 | - | $216 | $214,973 |
| Charles E. Golden | $94,750 | $150,007 | - | $216 | $244,973 |
| W August Hillenbrand (4) | $12,500 | - | - | $59 | $12,559 |
| William H. Kucheman | $76,750 | $150,007 | $162 | $226,919 | |
| Ronald A. Malone | $92,500 | $150,007 | - | $216 | $242,723 |
| Eduardo R. Menascé | $64,750 | $150,007 | - | $216 | $214,973 |
| Joanne C. Smith, M.D. | $79,250 | $150,007 | - | $216 | $229,473 |
| 1) | The amounts in this column include |
| 2) | The amounts indicated represent the grant date fair value of RSUs granted to our non-employee directors during fiscal As of September 30, 42,960. |
| 3) |
| Amounts in this column represent the dollar value of the voluntary director life and accidental death and dismemberment insurance premiums paid by us during fiscal |
| 4) | Mr. Hillenbrand left the Board in January 2014, and Mr. Dempsey was elected in March 2014. |
| EQUITY COMPENSATION PLAN INFORMATION |
The following table sets forth information concerning Hill-Rom's equity compensation plans as of September 30, 2011:2014:
Number of securities to be issued upon exercise of outstanding options, warrants and rights | Weighted-average exercise price of outstanding options, warrants and rights (1) | Number of securities remaining available for issuance under equity compensation plans (excluding securities reflected in column (a)) | Number of securities to be issued upon exercise of outstanding options, warrants and rights | Weighted-average exercise price of outstanding options, warrants and rights (1) | Number of securities remaining available for issuance under equity compensation plans (excluding securities reflected in column (a)) | |||||||
| Plan Category | (a) | (b) | (c) | (a) | (b) | (c) | ||||||
Equity compensation plans approved by security holders | 3,059,041 | $27.54 | 6,889,266 | 3,265,046 | $31.90 | 5,488,583 (4) | ||||||
Equity compensation plans not approved by security holders(2)(3) | 10,422 | - | - | 8,275 | $0.00 | - | ||||||
| Total | 3,069,463 | $27.54 | 6,889,266 (4) | 3,273,303 | $31.90 | 5,488,583 (4) | ||||||
| 1) | RSUs and PSUs are excluded when determining the weighted-average exercise price of outstanding stock options. |
| 2) | Under the Hill-Rom Holdings Stock Award Program, which has not been approved by security holders, shares of common stock have been granted to certain key employees. All shares granted under this program are contingent upon continued employment over specified terms. Dividends, payable in stock equivalents accrue on the grants and are subject to the same specified terms as the original grants. Under this program, a total of |
| 3) | Members of the Board of Directors may elect to defer fees earned and invest them in Hill-Rom common stock under the Hill-Rom Holdings Directors' Deferred Compensation Plan, which has not been approved by security holders. Under this program, a total of |
4) | Amount consists of |
| SECTION 16(a) BENEFICIAL OWNERSHIP REPORTING COMPLIANCE |
Under Section 16(a) of the Securities Exchange Act of 1934, our directors, our executive officers and any person holding more than ten percent of our common stock are required to file with the SEC initial reports of ownership and reports of changes in ownership of our common stock. We are required to report in this proxy statement any failure to file or late filing occurring during the fiscal year ended September 30, 2011.2014. Based solely on a review of filings furnished to us and other information from reporting persons, we believe that all of these filing requirements were satisfied by our directors, executive officers and ten percent beneficial owners, with the exception of two late Form 4 filings related to 445 shares of deferred stock granted to Mr. Golden and Mr. Hillenbrand in July 2011, in lieu of cash director’s fees.
owners.
48
HILL-ROM HOLDINGS, INC. 1069 STATE ROUTE 46 EAST BATESVILLE, IN 47006 | VOTE BY INTERNET - www.proxyvote.com Use the Internet to transmit your voting instructions and for electronic delivery of information up until 11:59 P.M. Eastern Time the day before the cut-off date or meeting date. Have your proxy card in hand when you access the web site and follow the instructions to obtain your records and to create an electronic voting instruction form. If you would like to reduce the costs incurred by our company in mailing proxy materials, you can consent to receiving all future proxy statements, proxy cards and annual reports electronically via e-mail or the Internet. To sign up for electronic delivery, please follow the instructions above to vote using the Internet and, when prompted, indicate that you agree to receive or access proxy materials electronically in future years. VOTE BY PHONE - 1-800-690-6903 Use any touch-tone telephone to transmit your voting instructions up until 11:59 P.M. Eastern Time the day before the cut-off date or meeting date. Have your proxy card in hand when you call and then follow the instructions. VOTE BY MAIL Mark, sign and date your proxy card and return it in the postage-paid envelope we have provided or return it to Vote Processing, c/o Broadridge, 51 Mercedes Way, Edgewood, NY 11717. |
TO VOTE, MARK BLOCKS BELOW IN BLUE OR BLACK INK AS FOLLOWS:
| KEEP THIS PORTION FOR YOUR RECORDS | ||
| DETACH AND RETURN THIS PORTION ONLY |
THIS PROXY CARD IS VALID ONLY WHEN SIGNED AND DATED.
| For | Withhold | For All | To withhold authority to vote for any | ||||||||
| All | All | Except | individual nominee(s), mark “For All | ||||||||
The Board of Directors recommends FOR the following: | Except” and write the number(s) of the nominee(s) on the line below. | ||||||||||
| o | o | o | |||||||||
| 1. Election of Directors | |||||||||||
| | |||||||||||
01 Rolf A. Classon 02 William G. Dempsey 03 James R. Giertz | ||||||||||||
| 06 | ||||||||||||
| The Board of Directors recommends you vote FOR proposals 2 and 3. | For | Against | Abstain | ||||||||||
2 To approve, by non-binding advisory vote, executive compensation. | o | o | o | ||||||||||
3 Ratify the appointment of PricewaterhouseCoopers LLP as independent registered public accounting firm for fiscal | o | o | o | ||||||||||
NOTE: Such other business as may properly come before the meeting or any adjournment thereof. | |||||||||||||
| Please sign exactly as your name(s) appear(s) hereon. When signing as attorney, executor, administrator, or other fiduciary, please give full title as such. Joint owners should each sign personally. All holders must sign. If a corporation or partnership, please sign in full corporate or partnership name, by authorized officer. | |||||||||||||
| Signature [PLEASE SIGN WITHIN BOX] | Date | Signature (Joint Owners) | Date | ||||||||||
Important Notice Regarding the Availability of Proxy Materials for the Annual Meeting: The are available at www.proxyvote.com . |
PROXY | ||
| This proxy is solicited by the Board of Directors | ||
The undersigned hereby appoints Rolf A. Classon and | ||
THIS PROXY CARD, WHEN PROPERLY EXECUTED, WILL BE VOTED IN THE MANNER DIRECTED HEREIN BY THE UNDERSIGNED. IF NO SUCH DIRECTION IS MADE BUT THE CARD IS SIGNED, THIS PROXY CARD WILL BE VOTED FOR THE ELECTION OF ALL NOMINEES UNDER PROPOSAL 1, FOR PROPOSAL 2, AND FOR PROPOSAL 3, AND IN THE DISCRETION OF THE PROXIES WITH RESPECT TO SUCH OTHER BUSINESS AS MAY PROPERLY COME BEFORE THE MEETING. | ||
| Continued and to be signed on reverse side | ||